- About $1.3511 trillion in US revolving debt carries rates from 20.94% (all accounts) to 22.15% (accounts assessed interest), generating an estimated $250 billion a year in interest and fees, 56.3% above the trailing 10-year average.
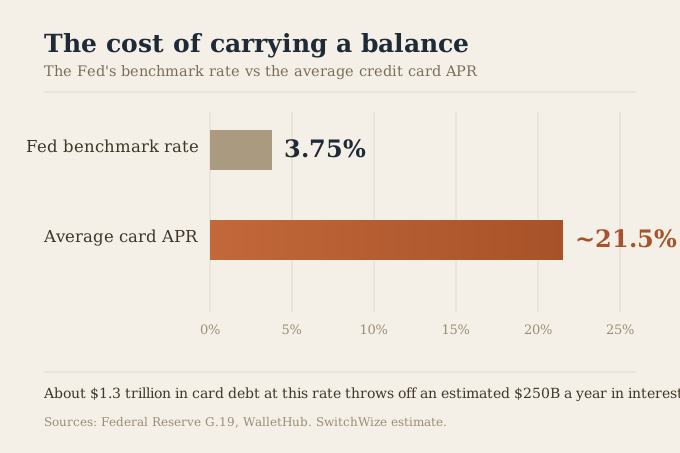
- The rate is high because it is priced as the Fed's rate plus a wide margin, now 14.3% over prime per the CFPB, and it barely fell when the Fed cut, so the gap over the 3.75% benchmark is the business.
- The burden is concentrated: fewer than half of cardholders carried a balance in the past year, on an average balance of $6,659, which costs roughly $1,475 a year in interest before any principal is repaid.
This report is the mirror image of a companion one. In the state of American cash, roughly $9.157 trillion in deposits earns almost nothing, an estimated $300 billion a year in interest left uncollected. Here the same behavioral gravity runs the other way: about $1.3511 trillion in credit card debt costs far too much, an estimated $250 billion a year handed over in interest and fees. One is money not earned; the other is money overpaid. Together they define the two most expensive habits in American household finance, and arguably the persistence of an "arbitrage type" return for the institutions sitting on both sides of the gap. This report lays out the debt side: the numbers, why the rate is so high, and what it costs a household. This page is reviewed by the SwitchWize Research Desk; the figures are sourced below with dates. Card rates last verified recently. These credit card debt statistics 2026 reveal the persistent financial burden carried by millions of American households.
The numbers
Four figures define the landscape:
- The debt. US revolving consumer credit, most of it credit cards, stood at a seasonally adjusted $1.3511 trillion in June 2026, per the Federal Reserve's G.19 Consumer Credit release (released Aug. 7, 2026).
- The rate. The average credit card APR is 20.94% across all accounts and 22.15% for accounts actually assessed interest, per the same G.19 series.
- The cost. Americans paid an estimated $250 billion or more ($253.37 billion exactly) in interest and fees in the past year, per WalletHub (Adam McCann, published Apr. 9, 2026) — 56.3% above WalletHub's own trailing 10-year annual average of $162.08 billion.
- The concentration. Only about 45% of cardholders carried a balance at some point in the prior 12 months, per Federal Reserve survey data (published May 26, 2026), so the cost falls on a minority.
These four figures come from three different datasets and should not be multiplied together as if they were one: the $1.3511 trillion is a point-in-time stock across every revolving account, including balances sitting in 0% promotions, while the $250 billion figure is WalletHub's own separate estimate of actual interest and fees paid over a year. We report WalletHub's figure as the cost estimate rather than deriving our own from the stock and the rate, precisely because that shortcut would overstate precision the underlying data doesn't support. This is the debt-side counterpart to the idle-cash tax: not interest forgone, but interest paid.
- Value
- $1.3511 trillion
- Source
- Federal Reserve G.19
- Value
- 20.94%
- Source
- Federal Reserve G.19
- Value
- 22.15%
- Source
- Federal Reserve G.19
- Value
- $253.37B (reported as $250B+)
- Source
- WalletHub
- Value
- +56.3%
- Source
- SwitchWize calc. from WalletHub data
- Value
- ~45%
- Source
- Federal Reserve
- Value
- ~$6,659
- Source
- Experian
- Value
- 14.3%
- Source
- CFPB
Why the rate is so high: the spread is the business
A rate in the low-to-mid 20s while the Federal Reserve's benchmark sits at 3.75% is not a market quirk. Credit card rates are priced as the prime rate, which tracks the Fed's benchmark, plus a margin, and per the Consumer Financial Protection Bureau, that margin reached 14.3% as of its most recent published analysis, the highest point in recent history, up from 9.6% a decade earlier. The margin reflects real factors, unsecured lending, revolving flexibility, and expected credit losses, but it is also where the profit is. Revolving interest is one of the card business's largest revenue sources alongside interchange and fees, and the size of the spread is a choice as much as a cost.
The minimum payment, typically a small percentage of the balance, has a simple mathematical effect: set low enough, it lets a balance revolve for years, and the longer it revolves, the more interest it produces. A borrower paying only the minimum is, in effect, choosing the slowest and most expensive path to zero, whatever the reason for that choice.
I spent years on the other side of interest-rate decisions like this one. A margin of 14 points over prime isn't set by chance — it's the core of the card business, and it's built to stay wide even after the Fed cuts. The only and most important variable a cardholder actually controls is how long a balance is allowed to sit there compounding.
— Adeesh Setya, former Treasurer, Merrill Lynch Bank USA and Morgan Stanley Bank USA
Why it barely fell when the Fed cut
Card rates share a trait with savings rates, in reverse. When the Fed raised rates through 2022 and 2023, card APRs rose quickly, because they are tied to prime and reprice almost immediately. When the Fed began cutting, card APRs proved far stickier on the way down, and average margins over prime actually widened over the period, blunting the relief a rate cut was supposed to deliver. Some issuers raised their margins pre-emptively ahead of regulatory changes, locking in a higher spread that a lower benchmark did not undo.
The result is asymmetry: fast up, slow down. It is the same pattern that keeps savings rates low after the Fed cuts, applied to the borrowing side. In both cases the bank captures the spread, and in both cases the customer who does not pay attention pays for it.
What it costs one household
Bring the aggregate down to a balance. Experian puts the average credit card balance across all cardholders at about $6,659. Applied to the 22.15% rate charged specifically on accounts assessed interest, the more relevant rate for a household actually carrying debt, that balance costs roughly $1,475 a year in interest alone, before a single dollar of principal is repaid. Paid off over years at close to the minimum, the total interest can approach or exceed the original balance, so a $6,659 debt can cost $12,000 or more by the time it clears.
That is the minimum-payment trap in one line: a low required payment feels affordable and keeps you paying for a decade. The calculator below shows how much faster a fixed payment above the minimum clears the balance, and how much interest it saves.
Model how long a fixed monthly payment takes to clear a credit card balance, and what it costs in interest.
Modeled total interest
$2,751
At this payment, the balance clears in about 42 months and costs roughly $2,751 in total interest.
What to do
That is a long payoff window and $2,751 in interest. A 0% balance-transfer card can pause the clock while you pay down principal.
Pre-tax estimates. For illustration only — not financial advice.
Cutting the rate does more than a bigger payment can. Moving a balance to a 0% balance-transfer card pauses the interest entirely for the promotional window, the single biggest lever before any repayment math even starts. Current offers, ranked by intro length:
The honest counterargument
The $250 billion figure invites two fair objections. The first: most cardholders pay no interest at all. That is true, and it does not soften the finding; it sharpens it. Because fewer than half of cardholders carried a balance at some point in the past year, and fewer still carry one every month, the entire cost is concentrated on a minority, which means the burden per affected household is far heavier than a national average implies. The people paying are not paying a little each; they are paying a lot.
The second objection is more precise: WalletHub's $253.37 billion is interest and fees combined, not interest alone, and not every fee stems from revolving a balance. An annual fee, for instance, can be charged to a cardholder who pays the statement in full every month and carries no debt at all. That means the figure somewhat overstates what "carrying a balance" specifically costs, and understates what interest alone costs the true revolver population. We don't have a public breakdown of WalletHub's total by interest versus fees, so we report the combined number as WalletHub publishes it rather than guessing at a split.
It is also true that not all of the $1.3511 trillion revolves at the full rate, that some balances sit in 0% promotional periods, and that credit cards deliver real value, rewards, fraud protection, and a grace period, to those who pay in full. None of that is in dispute. The report is about the cost borne by the households that carry balances, and for them the arithmetic is stark and the escape is well defined. The value of a card to someone who pays in full says nothing about the cost to someone who does not.
Methodology
The debt figure ($1.3511 trillion, seasonally adjusted, June 2026 data) and the two APR figures (20.94% all accounts, 22.15% accounts assessed interest) come directly from the Federal Reserve's G.19 Consumer Credit release (released Aug. 7, 2026), cross-referenced with our own market snapshot, which tracks the same FRED series. The $253.37 billion interest-and-fees total, reported as "$250 billion or more," is WalletHub's own separate estimate for 2025 (Adam McCann, published Apr. 9, 2026); we report it as WalletHub's figure rather than re-deriving it by multiplying the debt stock by an average rate, since that shortcut would combine a point-in-time balance figure with a period-average rate as if they were compatible, overstating the precision either number can support on its own. The 56.3% year-over-decade comparison is our own calculation, but only against WalletHub's own trailing 10-year average from the same measurement framework, which is a valid comparison because both numbers share a methodology. The 14.3% issuer-margin-over-prime figure is the CFPB's own published finding, not a SwitchWize estimate. The per-household figure applies the 22.15% assessed-interest rate, not the all-accounts blend, to Experian's average balance across all cardholders ($6,659), since that balance is not itself specific to revolvers; the interest cost is the balance times the rate, before principal repayment, and the payoff-time illustration assumes payments near the typical minimum. A machine-readable version of the underlying interest-drag scenarios is published at /data/credit-card-interest-drag.json. Nothing here is individualized financial advice.
How we source this. Debt and rate figures come from the Federal Reserve's G.19 release and our FRED-tracking market snapshot; the interest-and-fees total from WalletHub; the balance figure from Experian, all cited with dates. See our methodology and editorial team. We take no payment for organic rankings.
The figures above are a fixed dataset, current as of the release date cited. The snapshot below pulls the same two Federal Reserve series live, so it moves as new data lands rather than waiting for our next full update.
Audit trail.
- Value
- $1,351.1B ($1.3511T exact)
- Source
- Federal Reserve G.19 Consumer Credit
- Source date
- June 2026 data, released Aug. 7, 2026
- SwitchWize transformation
- None — exact figure used
- Value
- 20.94%
- Source
- Federal Reserve G.19
- Source date
- Same release
- SwitchWize transformation
- None
- Value
- 22.15%
- Source
- Federal Reserve G.19
- Source date
- Same release
- SwitchWize transformation
- None
- Value
- 3.50%-3.75%
- Source
- Federal Reserve FOMC
- Source date
- Held July 29, 2026
- SwitchWize transformation
- None
- Value
- $253.37B, reported as "$250B or more"
- Source
- WalletHub (Adam McCann)
- Source date
- Published Apr. 9, 2026
- SwitchWize transformation
- Rounded down for headline
- Value
- $162.08B, reported as "~$160B"
- Source
- WalletHub
- Source date
- Published Apr. 9, 2026
- SwitchWize transformation
- Rounded
- Value
- 56.3%
- Source
- SwitchWize calculation from WalletHub data
- Source date
- Aug. 9, 2026
- SwitchWize transformation
- ($253.37B ÷ $162.08B) − 1, rounded to one decimal
- Value
- ~45%
- Source
- Federal Reserve, Economic Well-Being of US Households in 2025
- Source date
- Published May 26, 2026
- SwitchWize transformation
- None
- Value
- $6,659
- Source
- Experian
- Source date
- March 2026 data
- SwitchWize transformation
- None — not revolver-specific, used as the closest available proxy
- Value
- ~$1,475/yr ($1,474.97 exact)
- Source
- SwitchWize calculation
- Source date
- —
- SwitchWize transformation
- $6,659 × 22.15% (assessed-interest rate, not the blended average)
- Value
- 14.3%, up from 9.6% a decade earlier
- Source
- Consumer Financial Protection Bureau
- Source date
- Most recent published CFPB analysis
- SwitchWize transformation
- None
Sources
- Federal Reserve, G.19 Consumer Credit for revolving credit outstanding and the average card APR series (June 2026 data, released Aug. 7, 2026).
- Federal Reserve, FOMC statement, July 29, 2026: federal funds target held at 3.50%-3.75%.
- WalletHub, Adam McCann, how much Americans pay in credit card interest and fees (published Apr. 9, 2026): the $253.37B interest-and-fees estimate and $162.08B trailing 10-year average.
- Federal Reserve, Economic Well-Being of US Households in 2025 (published May 26, 2026) on the share carrying a balance; Experian for the average balance.
- Consumer Financial Protection Bureau, Credit card interest rate margins at all-time high: the 14.3% margin-over-prime figure, up from 9.6% a decade earlier.
Figures are current as of mid-2026 and rounded. The interest-and-fees total is an external estimate; the per-household figures are arithmetic from the average balance and rate. Free to cite with attribution to SwitchWize.
What to Do Now
Illustrate first-target interest differences between highest-rate-first and smaller-balance-first strategies.
Find this on your card or loan statement
Find this on your card or loan statement
Simplified Interest Estimate (Avalanche Priority)
$4,215
Use this result as one input in your broader Money Map, not as a one-off number.
What to do
Explore debt payoff options
Pre-tax estimates. For illustration only — not financial advice.
Frequently Asked Questions
How much credit card debt do Americans have in 2026?
What is the average credit card interest rate in 2026?
How much do Americans pay in credit card interest and fees each year?
Why are credit card interest rates so high?
What is the fastest way to get out of credit card debt?
Act on this: today's top cards

Ranked by SwitchWize's composite score. We may earn a referral fee, and it never changes the ranking order.
Editorial review
What changed since the last update
Was this guide helpful?
Found an inaccurate, outdated, or missing claim? Report a correction. We verify reports against the relevant source before changing a guide or ranking.

Adeesh Setya is Head of Financial Research & Principal at SwitchWize, with 25+ years of experience in deposits, treasury management, banking products, and financial services. He previously served as Treasurer at Merrill Lynch Bank USA and Morgan Stanley Bank USA, where he managed bank funding, deposits, and interest-rate risk. He writes on Federal Reserve policy, the general marketplace for banking products, and what they mean for savers and consumers.
Available for on-record interviews, background briefings, and custom data cuts.
research@switchwize.com