- The Bank Gap Index is the distance between the FDIC national-average savings rate and the mean of the top three widely available savings rates, priced on a $25,000 balance.
- The gap is a bank pricing decision, not a Fed outcome, which is why it survives rate cuts and rate holds alike.
- Closing it adds no risk as long as the entire deposit is FDIC insured, i.e., the low-paying and high-paying accounts carry the same federal deposit insurance. The full monthly history is published as an open dataset.
Most personal-finance coverage answers one question: what does the best savings account pay right now. That number is only half of what matters. The number that actually describes your situation is the distance between what your own bank pays and what the best account pays, because that distance, not the headline rate, is what your inertia is costing you. We use the word "inertia" respectfully. It is not a value judgment on you, just a way of pointing out that inaction on your part (regardless of the reason) likely translates into economic loss for you. SwitchWize tracks that distance every month and calls it the Bank Gap Index. This report defines it precisely: what it measures, how it is calculated, why it persists, and what it is worth on a real balance. Figures were last verified recently. Understanding what is the Bank Gap Index helps you quantify the real cost of staying with your current financial institution.
What the Index measures
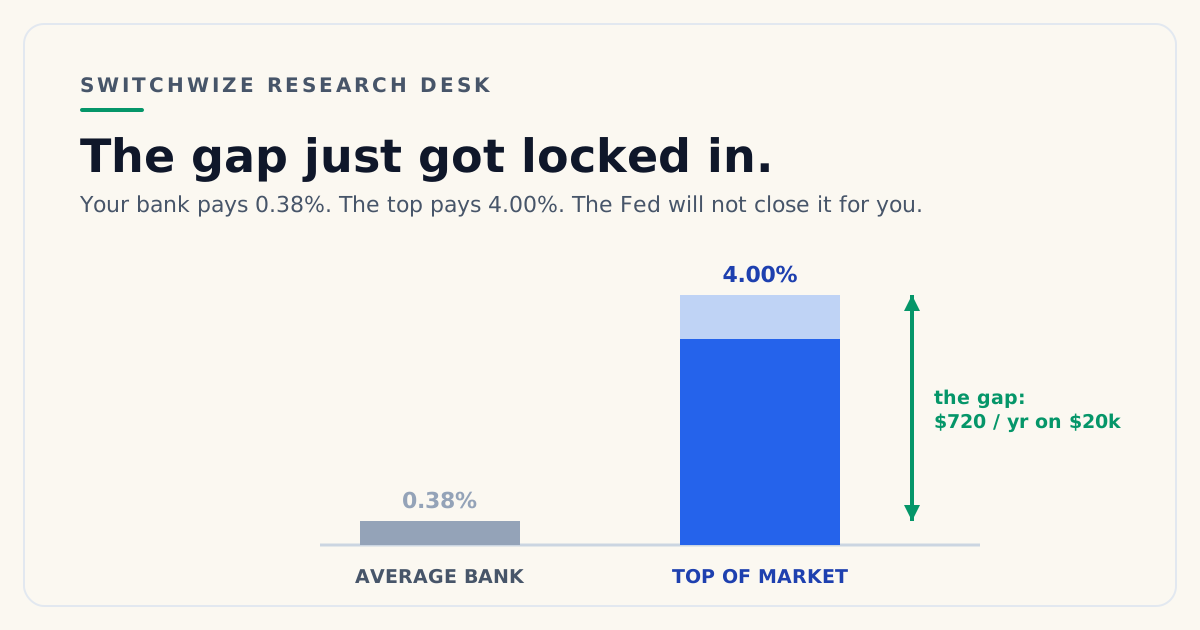
The Bank Gap Index answers one question: on a representative balance, how much annual interest does a saver give up by earning the national-average savings rate instead of a top-available rate. As of today, the national average sits near 0.38% and the top of the market sits near 4.20%.
SwitchWize Bank Gap Index
3.82 pp
On a $20,000 balance, that gap is worth about $764 a year. Best available: 4.20% APY. National average: 0.38% APY.
Updated from live rate data. Gap = best widely available rate − FDIC national average.
The formula
Bank Gap Index = Representative Balance x (Top-Available APY - National-Average APY)
- Representative Balance — $25,000. A fixed reference balance, held constant so month-over-month changes in the Index reflect rate movements, not a shifting balance assumption. It approximates a common mid-range savings or emergency-fund balance and is a unit of measurement, not a claim about any individual's savings.
- National-Average APY. The FDIC national average for savings deposits, the standard published benchmark for what U.S. savings accounts pay on average. It is intentionally an average, not a megabank floor.
- Top-Available APY. The mean of the top three savings APYs in SwitchWize's tracked set of savings institutions, deliberately an average of three rather than a single best rate, so the figure represents a rate a saver can realistically obtain from more than one provider rather than a capped, time-limited, or balance-restricted promotional outlier.
See the full methodology page for the current inputs and live worked calculation.
Why the gap doesn't close on its own
The gap is not a market accident, and it is not set by the Federal Reserve. The Fed sets a benchmark rate; individual banks decide how much of any change in that benchmark to pass through to their own depositors, a behavior economists call deposit beta. A bank with a largely inert depositor base has little competitive pressure and can run a low beta, paying close to the floor no matter what the Fed does. A bank competing for every deposit, typically one with no branch network to fall back on, has to run a high beta to win and keep customers.
Because the decision sits with banks rather than policy, the gap has persisted through both directions of the rate cycle: it widened through the 2022 to 2023 hiking cycle as top rates tracked the Fed up while national-average rates barely moved, and it has not meaningfully narrowed through the subsequent cuts and holds either, since a bank that already pays near zero has almost nowhere lower to go and little incentive to raise it. This pattern is documented, not just inferred: the Federal Reserve's own analysis of the 2022 cycle found deposit-rate pass-through "more muted in the aggregate" and increasingly heterogeneous bank to bank, with larger banks running lower betas than smaller ones. For the mechanics behind why banks price this way, see the State of American Cash report, which covers deposit beta and net interest margin in full.
What it costs
The percentage-point gap is abstract on its own, so the Index prices it in dollars. On the $25,000 representative balance, the gap above translates directly into the annual forgone-interest figure shown in the box above. Scaled to other balances, the same rate gap produces a proportionally larger or smaller dollar cost:
These are live, tracked rates at FDIC-insured institutions, the same tracked set that feeds the Index's Top-Available APY input.
The national gap is the headline, but the after-tax version of it is not the same in every state. Treasury interest is generally exempt from state income tax, so in high-tax states a Treasury bill or government money market fund can beat a fully taxable savings account after tax by more than the pre-tax APY difference suggests; in no-income-tax states that advantage disappears and the highest APY simply wins. SwitchWize breaks the gap out by state, with a dedicated page and tax-specific math for all 50 states.
The honest counterargument
A savings account is not a household's only cash bucket, and the Bank Gap Index does not claim otherwise. Some balances are transactional and need to sit where bills are paid rather than where the yield is highest. Some savers accept a lower rate deliberately, for a branch relationship, a linked checking overdraft feature, or simplicity. And the Index's own construction is conservative by design: averaging the top three rates rather than citing a single best rate already discounts the number below the true ceiling available to a saver willing to shop the whole market.
None of that changes the conclusion, it only bounds it. Even a saver who keeps meaningful transactional cash at a legacy bank can move the portion that is genuinely idle without adding any risk, since the FDIC insurance is identical at both ends of the gap. The Index is not a claim that every dollar should move. It is a measure of what is available to move, conservatively priced, updated monthly, and published in full so the number can be checked rather than taken on faith.
Methodology
The Bank Gap Index is computed as Representative Balance x (Top-Available APY - National-Average APY), with the Representative Balance fixed at $25,000, the National-Average APY sourced from the FDIC's published national rate for savings deposits, and the Top-Available APY computed as the mean of the top three savings APYs in SwitchWize's tracked institution set. The Index is recalculated continuously from live rate data and recorded as a dated monthly snapshot; the full history, with one row per month for the Index value, both input APYs, the gap in percentage points, and the number of institutions tracked, is published at /data/bank-gap-index.json. Once published, a given month's snapshot is not revised when live rates later change; only a new month's row is added, so a reading cited today will still match that same historical row later. The Index is a measure of forgone interest, not a loss in the accounting sense: a saver earning the national average has not lost money, they have earned less than was readily available on an equally insured account (FDIC coverage generally applies up to $250,000 per depositor, per insured bank, per ownership category, on both ends of the gap). It is not financial advice. The full canonical definition, current inputs, and a live worked calculation are on the Bank Gap Index methodology page; the live figure itself is on the Bank Gap Index page.
How we source this. The national-average input is the FDIC's own published rate; the top-available input is drawn from SwitchWize's own tracked institution set, verified on a rolling basis; see our methodology and editorial team. We take no payment for organic rankings, and this report and its dataset are free to cite with attribution.
Audit trail. Unlike the other flagship reports on this desk, every input here is live rather than a fixed historical figure, so the table below describes the formula and inputs rather than point-in-time values — read the live number from the widgets above or /data/bank-gap-index.json.
- Definition
- FDIC's published national savings rate
- Source
- FDIC National Rates and Rate Caps
- Update cadence
- Rolling
- SwitchWize transformation
- None
- Definition
- Mean of the top three tracked savings APYs
- Source
- SwitchWize tracked institution set
- Update cadence
- Rolling
- SwitchWize transformation
- Averaged, not single-best
- Definition
- Fixed reference balance
- Source
- SwitchWize
- Update cadence
- Fixed by design
- SwitchWize transformation
- $25,000, held constant so the Index tracks rate movement, not balance assumptions
- Definition
- Balance × (Top-Available − National-Average)
- Source
- SwitchWize calculation
- Update cadence
- Continuous, monthly snapshot archived
- SwitchWize transformation
- Formula applied to the two live inputs above
Sources
- FDIC, National Rates and Rate Caps: National-Average APY input.
- SwitchWize tracked savings-institution set: Top-Available APY input, refreshed on a rolling basis.
- SwitchWize Bank Gap Index methodology page: full formula, current inputs, and worked calculation.
- /data/bank-gap-index.json: full monthly time series.
- On why the gap persists as a bank-pricing decision: Federal Reserve Board of Governors, FEDS Notes, "Is This Time Different: How Are Banks Performing during the Recent Interest Rate Increases Compared to 2004-2006?" (Apr. 12, 2024), which documents muted, increasingly bank-heterogeneous deposit-rate pass-through, with larger banks running lower betas in the 2022 cycle.
Figures are live as of the date shown and change as rates change; the monthly dataset is the durable, citable record. This report is informational, not financial advice. Free to cite with attribution to SwitchWize.
Source: S&P Capital IQ Pro; SNL Financial Data. Calculations: FDIC. Reflects the $2,500 product tier for savings and interest checking accounts.
Frequently Asked Questions
What is the Bank Gap Index?
How is the Bank Gap Index calculated?
Why doesn't the gap close on its own?
Is closing the gap risky?
How often is the Bank Gap Index updated?
The 5-minute money briefing
One email per week. New rates, fed moves, and what to actually do about them.
No spam. Unsubscribe anytime.
Act on this: today's top savings



Ranked by SwitchWize's composite score. We may earn a referral fee, and it never changes the ranking order.
Editorial review
What changed since the last update
Was this guide helpful?
Found an inaccurate, outdated, or missing claim? Report a correction. We verify reports against the relevant source before changing a guide or ranking.

Adeesh Setya is Head of Financial Research & Principal at SwitchWize, with 25+ years of experience in deposits, treasury management, banking products, and financial services. He previously served as Treasurer at Merrill Lynch Bank USA and Morgan Stanley Bank USA, where he managed bank funding, deposits, and interest-rate risk. He writes on Federal Reserve policy, the general marketplace for banking products, and what they mean for savers and consumers.
Available for on-record interviews, background briefings, and custom data cuts.
research@switchwize.com