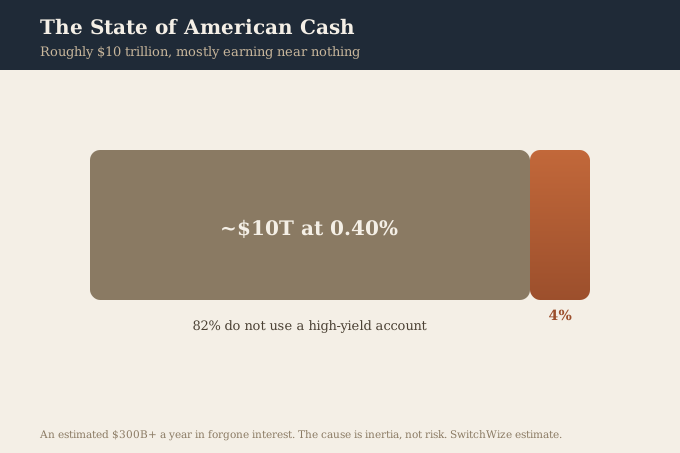
- US households hold roughly $9.157 trillion in time and savings deposits earning a national-average 0.38%, while widely available high-yield accounts pay close to 4% under the same FDIC insurance. Time deposits are not a one-for-one comparison with high-yield savings, but several principles of customer behavior still hold.
- That gap represents an estimated $300 billion or more a year in forgone interest (about $330 billion in our base case), an illustrative upper bound before behavioral limits.
- The cause is inertia, not risk or eligibility: about 82% of Americans do not use a high-yield account, and 43% of savers do not know their own rate.
America's cash is in a strange state. Households hold near-record deposits. The accounts are federally insured. Better rates are widely available, free to open, and carry the same protection. And yet the overwhelming majority of that money earns almost nothing. This is not a story about a lack of options or an economy that fails savers. It is a story about a gap that exists because of how banks price deposits and how little most people watch. This report lays out the numbers, the mechanics that opened the gap, the causes on both sides, and the scale. Figures were last verified recently. Understanding the state of American cash 2026 begins with recognizing how these deposit gaps persist despite widespread awareness and readily available alternatives.
The through-line is simple and uncomfortable: a very large avoidable cost in American household finance is not a fee or a scam. It is the interest people are implicitly declining to collect by leaving cash where it has always been: in low-yielding accounts.
The numbers
Four figures define the landscape:
- The pool. US households and nonprofits hold $9.157 trillion in time and savings deposits as of Q1 2026, per Federal Reserve data, FRED series TSDABSHNO (Households and Nonprofit Organizations; Total Time and Savings Deposits).
- The default savings rate. The FDIC national-average savings rate was 0.38% as of July 20, 2026 (reflecting data through the June 30, 2026 month-end).
- The available rate. Widely available high-yield savings accounts pay close to 4%, with the same FDIC insurance. We use 4.00% rather than the single highest advertised rate, since a promotional or balance-capped outlier would overstate what a typical saver can actually lock in; several tracked accounts pay somewhat more.
- The adoption gap. About 82% of Americans do not use a high-yield account, per CNBC Select (published Aug. 1, 2025), and roughly two-thirds of savers earn less than 4%, per a Bankrate/YouGov survey (fielded Feb. 20-23, 2024; n=3,581, including 2,406 with short-term savings).
Put the rates against the pool and the aggregate emerges. At 0.38%, that $9.157 trillion earns about $35 billion a year. At 4%, it would earn about $366 billion. The differential, about $331 billion, is interest that is potentially available and goes uncollected — we round this down and report it as an estimated $300 billion or more, a deliberately conservative headline rather than a stretch. This is the idle-cash tax, and it is an illustrative upper bound, since not all deposits can or should chase yield.
- Value
- ~$9.157 trillion
- Source
- Federal Reserve (FRED TSDABSHNO)
- Value
- ~0.38%
- Source
- FDIC
- Value
- ~4%
- Source
- Market
- Value
- ~82%
- Source
- CNBC Select
- Value
- ~$330B/yr (reported as $300B+)
- Source
- SwitchWize estimate
How the gap got this wide
The gap was not always this large. It opened during the most aggressive Federal Reserve tightening in four decades. Between early 2022 and mid-2023, the Fed lifted its benchmark rate from near zero to above 5%. In a theoretical finance construct, the rate paid on savings would have climbed alongside it in approximate lockstep. That is not what happened, and the reason is a piece of banking mechanics called deposit beta.
Deposit beta measures how much of a change in the Fed's rate a bank passes through to its depositors. A beta of 1.0 is a full pass-through; a beta near zero means the bank keeps almost the entire increase and hands savers almost none of it. Through the 2022 to 2023 cycle the two halves of the market behaved as opposites. Online banks ran high betas, and their high-yield rates tracked the Fed upward, crossing 5% by late 2023 before easing back toward 4% as the Fed began cutting. The FDIC national-average, which is dominated by the deposit volume of the largest traditional banks, tells the other side of the story at the aggregate level: the Fed's benchmark rose more than five percentage points, while the national-average savings rate never cleared half a percent, consistent with a near-zero beta at the institutions that set that average. We infer this from comparing the two published series over the same period, not from a bank-by-bank calculation, and actual betas vary by institution, product, and funding need. Same central bank, same rate moves, two entirely different outcomes for savers, decided in large part by which bank happened to hold the money and how it chose to exercise its option to price deposits.
Why banks let it persist
A gap this large and this durable is not an oversight. It is a business model. For a bank, low-rate deposits are the cheapest source of funding it has. When a bank pays 0.38% on a savings balance and lends or invests that money at 6 or 7%, the difference is its net interest margin, the single largest driver of bank profitability. A bank that declines to pass a basis point through to depositors keeps it as funding-cost savings, though how much of that ultimately reaches profit depends on balance migration, hedging, other net expenses, and what it does with the funding.
That creates a deliberate asymmetry in how fast rates move. When the Fed raises rates, the interest a bank charges on new loans reprices within days, because a bank that underprices a new loan leaves money on the table. Existing loans are of course bound by explicit contracts between the bank and the borrower. The interest it pays on deposits reprices slowly, or not at all, because most depositors do not move their balances. Bank regulators have documented the pattern directly: through the last cycle many institutions intentionally delayed deposit-rate increases to protect net interest margins. Loans up fast, deposits up slow, and the spread between them is the point.
What makes the strategy work is deposit stickiness. A bank can pay near-zero and keep the money only because the money stays. The accounts that pay the least tend to be the ones held longest by customers who have never compared alternatives, so the low rate and the loyal customer are usually the same account. For the bank, an inert depositor is not a weak relationship; it is the most profitable version of one. None of this is illegal or hidden. It is simply how deposit pricing works when the customer is not paying attention, which is the state most cash is in.
I managed bank deposit books for years. A near-zero deposit beta isn't an accident — it's the business working exactly as intended, and a very conscious and lucrative part of a bank's strategy. The bank isn't doing anything wrong by paying 0.38%. It's simply betting that most depositors won't move, and for years that bet has been right.
— Adeesh Setya, former Treasurer, Merrill Lynch Bank USA and Morgan Stanley Bank USA
On the saver's side, the cause is inertia
If banks supply the low rate, savers supply the stickiness of their balances that lets it stand. The natural assumption is that people who earn 0.38% must be shut out of better rates somehow, by minimums, by credit, by risk. The data says otherwise. High-yield accounts are FDIC insured, widely available, and easy to open. The barrier is not access. It is that most people never look: about 43% of savers do not know the interest rate on their own account, per a LendingClub-commissioned survey conducted by Talker Research.
That single fact explains the rest. A rate you never check is a rate you implicitly accept. You cannot act on a gap you have not seen, or been nudged to see. So the money stays put, not by a considered decision to earn less, but by an unconscious indifference. The loss is invisible because it takes the form of interest that never arrives, and invisible losses do not trigger action. The two sides fit together exactly: the bank's most profitable customer and the rate-indifferent saver are usually the same person.
Why the scale is so large
Two forces multiply the cost. First, the sheer size of the pool: with roughly $9.157 trillion in deposits, even a modest rate gap compounds into hundreds of billions. Second, the concentration at the bottom: the national average is dragged down by large traditional banks that pay near-zero and rely on customer inertia to keep low-cost deposits. The result is a system where the default outcome, doing nothing, is also close to the worst outcome, and where the better outcome asks only a couple of hours on any open afternoon.
The rate gap itself does not vary by state, since the top available accounts are national online banks, but what closing it is worth after-tax is state dependent: Treasury interest is generally exempt from state income tax, which changes the best move in a high-tax state versus a no-tax one. We break this out for all 50 states.
The honest counterargument
The $300 billion figure is an upper bound, and the case against it is worth stating plainly. Not all of the roughly $9.157 trillion can or should move. A meaningful share is transactional: money passing through checking to cover the mortgage, the card, and payroll, balances that need to sit where the bills are paid rather than where the yield is highest. Some depositors knowingly accept a lower rate for a branch network, an existing relationship, or the simplicity of keeping everything in one place. And a slice of the pool already earns more than 0.38%.
Haircut the number for all of that and the conclusion barely changes. Suppose only half the pool is genuinely movable and the realistic gain is three points rather than 3.6. That is still well over $100 billion a year, and it still resolves, on a single household's balance sheet, into hundreds or thousands of dollars a person can collect by moving money between two insured accounts. The aggregate is debatable at the margin. The per-household math on average is not.
What it means for one household
The national figure is abstract, so bring it down to a balance. A household holding $25,000 at the 0.38% average earns about $95 a year. The same balance at 4% earns about $1,000, a gap near $900, guaranteed, on federally insured money. On $50,000, the annual gap is about $1,810. Your personal share of the national shortfall is simply your balance times the rate gap, and unlike the aggregate, it is entirely within your control.
These are the rates on the other side of that gap, live as of today, all at FDIC-insured banks:
Methodology
The aggregate estimate uses one explicit base case: the Federal Reserve's FRED series TSDABSHNO, "Households and Nonprofit Organizations; Total Time and Savings Deposits," exactly $9,156,731 million ($9.157 trillion) as of Q1 2026, times the spread between the FDIC national-average savings rate (0.38%) and a widely available high-yield rate (4.00%), a gap of 3.62 percentage points. That yields $9.157 trillion × 3.62% = $331.5 billion ($9,156,731,000,000 × 0.0362 = $331,473,662,200, before rounding), which we round down and report as an estimated "$300 billion or more," a deliberately conservative headline rather than a stretch. We use the exact FRED observation rather than a rounded $9.2 trillion, since the precise figure is available and a rounded input would only add noise. We do not add checkable-deposit balances to this figure; TSDABSHNO already excludes them, and mixing series would inflate the base beyond what any single dataset supports. We treat the resulting figure as an illustrative upper bound regardless: transactional balances, minimum-balance needs, and accounts already above 0.38% all argue for a conservative reading, and the counterargument section above works one such haircut in full. The per-household figures are the numbers most readers should act on.
This is not the first time an aggregate figure like this has surfaced: an Ally Bank deposits executive told CNBC in 2019 that Americans were forgoing roughly $50 billion a year in interest by that measure. Our figure is larger because both drivers have grown since then: household deposits are larger in 2026 than in 2019, and the rate spread widened considerably after the 2022 to 2023 hiking cycle, when top accounts tracked the Fed toward 5% while the national average barely moved. Same phenomenon, wider gap, larger base.
The deposit-beta and net-interest-margin sections describe well-documented banking mechanics rather than proprietary estimates. Deposit beta is a standard measure of deposit-rate pass-through; the observation that the FDIC national average implies a near-zero beta at the institutions that dominate it through the 2022 to 2023 cycle follows from comparing the Fed's benchmark path against the FDIC national-average series over the same period, an aggregate-level inference, not a bank-by-bank calculation, and actual betas vary by institution. The point that banks reprice loans faster than deposits to protect net interest margin is drawn from published Federal Reserve bank research, cited below. Where we describe intent, we mean the documented industry pattern, not a claim about any single named bank. A machine-readable version of this report's figures is published at /data/idle-cash-gap.json -- as of August 2026 that dataset fetches the FRED TSDABSHNO figure and SwitchWize's live rate spread directly rather than repeating this article's dated snapshot, so its exact numbers will drift from the ones printed above as rates move; this article's own figures are a point-in-time reading, re-verified on the cadence noted in ratesVerifiedAt, not a live feed.
How we source this. Rates are sourced from primary institutions and the FDIC, not aggregated marketing pages, and are verified on a rolling basis; see our methodology and editorial team. This report was written by a former bank treasurer and reviewed by the SwitchWize Research Desk. We take no payment for organic rankings or citations.
Audit trail.
- Value
- $9,156,731 million ($9.157 trillion)
- Source
- Federal Reserve, FRED TSDABSHNO
- Source date
- Q1 2026 observation
- SwitchWize transformation
- None — exact figure used, not rounded
- Value
- 0.38%
- Source
- FDIC National Rates and Rate Caps
- Source date
- July 20, 2026 (reflects data through June 30, 2026)
- SwitchWize transformation
- None
- Value
- 4.00%
- Source
- SwitchWize tracked institution set
- Source date
- Rolling
- SwitchWize transformation
- Deliberately below the single highest advertised rate to avoid a promotional outlier
- Value
- $331.5B ($331,473,662,200 exact), reported as "$300B or more"
- Source
- SwitchWize calculation
- Source date
- —
- SwitchWize transformation
- $9,156,731,000,000 × (4.00% − 0.38%), rounded down for the headline
- Value
- 82%
- Source
- CNBC Select
- Source date
- Published Aug. 1, 2025
- SwitchWize transformation
- None
- Value
- ~67% (two-thirds)
- Source
- Bankrate/YouGov survey
- Source date
- Fielded Feb. 20-23, 2024; published Mar. 27, 2024; n=3,581
- SwitchWize transformation
- None
- Value
- 43%
- Source
- LendingClub-commissioned, Talker Research-conducted survey
- Source date
- Oct. 2025, n=2,000
- SwitchWize transformation
- None
- Value
- ~$50B/yr
- Source
- CNBC (Anand Talwar, Ally Bank)
- Source date
- 2019
- SwitchWize transformation
- Cited as directional third-party corroboration, not adjusted
Sources
- Federal Reserve, Households and Nonprofit Organizations; Total Time and Savings Deposits (FRED TSDABSHNO) — the deposit-pool figure.
- FDIC, National Rates and Rate Caps — the 0.38% national-average savings rate.
- CNBC Select, on high-yield savings adoption (published Aug. 1, 2025); Bankrate, two-thirds of savers earn less than 4% (YouGov survey for Bankrate, fielded Feb. 20-23, 2024, published Mar. 27, 2024, n=3,581).
- LendingClub-commissioned survey conducted by Talker Research (2,000 respondents, October 2025) — the 43% who do not know their own savings rate.
- CNBC, Ally Bank's prior independent estimate of ~$50B/year in forgone interest (2019), cited here as directional third-party corroboration that predates the wider post-2022 rate spread.
- On deposit beta and asymmetric repricing: Federal Reserve Board of Governors, FEDS Notes, "Is This Time Different: How Are Banks Performing during the Recent Interest Rate Increases Compared to 2004-2006?" (Apr. 12, 2024) — finds deposit-rate pass-through "more muted in the aggregate" and "more heterogenous" at the bank level in the 2022 cycle than in 2004-2006, with larger banks running lower betas; Federal Reserve Board of Governors, March 2024 Senior Financial Officer Survey, which defines deposit beta and surveys banks directly on Fed-rate pass-through strategy.
Figures are current as of mid-2026 and rounded. The forgone-interest figure is a SwitchWize Research Desk estimate and an illustrative upper bound; see methodology. The deposit-beta and net-interest-margin discussion describes documented banking mechanics, not a claim about any individual institution. Free to cite with attribution to SwitchWize.
Frequently Asked Questions
How much cash do Americans hold in the bank?
What does the average savings account earn versus a high-yield account?
How much interest are Americans leaving on the table?
Why don't more Americans use high-yield savings accounts?
Why don't banks just raise their savings rates?
Act on this: today's top savings


Ranked by SwitchWize's composite score. We may earn a referral fee, and it never changes the ranking order.
Editorial review
What changed since the last update
Was this guide helpful?
Found an inaccurate, outdated, or missing claim? Report a correction. We verify reports against the relevant source before changing a guide or ranking.

Adeesh Setya is Head of Financial Research & Principal at SwitchWize, with 25+ years of experience in deposits, treasury management, banking products, and financial services. He previously served as Treasurer at Merrill Lynch Bank USA and Morgan Stanley Bank USA, where he managed bank funding, deposits, and interest-rate risk. He writes on Federal Reserve policy, the general marketplace for banking products, and what they mean for savers and consumers.
Available for on-record interviews, background briefings, and custom data cuts.
research@switchwize.com