- US households hold roughly $9.157 trillion in time and savings deposits earning a national-average 0.38%, while widely available online accounts pay close to 4%.
- SwitchWize estimates that spread represents about $331 billion in forgone interest a year, reported as an estimated $300 billion or more — an upper bound before behavioral limits.
- The barrier is inertia, not eligibility: about 82% of Americans do not use a high-yield savings account, and 43% of savers do not know their own rate.
There is a cost hiding in plain sight on the American household balance sheet, and it does not show up as a fee, a loss, or a bad investment. It shows up as nothing happening. Money sits in a savings account, the balance holds steady, and the account quietly pays a fraction of what the same dollars could earn a few clicks away. Multiplied across the country, that stillness adds up to one of the largest avoidable costs in consumer finance. Understanding idle cash forgone interest 2026 requires recognizing how this cumulative gap compounds across millions of American households nationwide.
Call it the idle-cash tax. It is not levied by anyone. It is simply the interest Americans decline to collect.
The finding
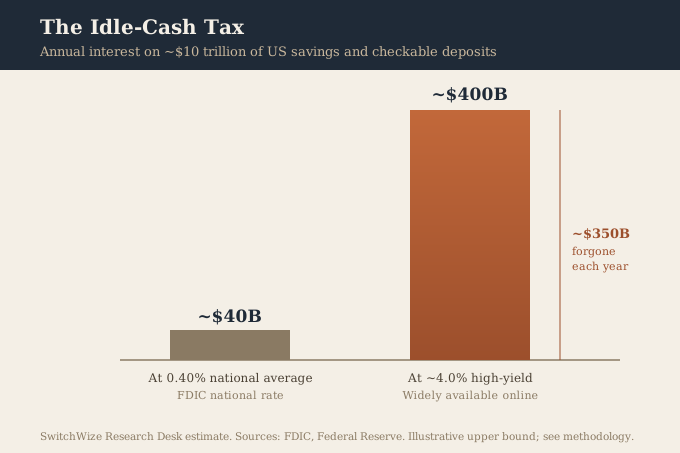
Two numbers set the boundaries. US households and nonprofits hold roughly $9.157 trillion in time and savings deposits, according to Federal Reserve data (FRED series TSDABSHNO). And the FDIC national-average savings rate sits at about 0.38%, while savings accounts paying close to 4% are widely available and federally insured.
Put those together. At 0.38%, that $9.157 trillion earns about $35 billion a year. At 4%, it would earn about $366 billion. The distance between them, about $331 billion a year, is interest that exists, is available, and mostly goes uncollected. We report this conservatively as an estimated $300 billion or more.
- Rate
- ~0.38%
- Annual interest on ~$9.157T
- ~$35 billion
- Rate
- ~4.0%
- Annual interest on ~$9.157T
- ~$366 billion
- Rate
- 3.62 pts
- Annual interest on ~$9.157T
- ~$331B forgone (reported as $300B+)
This is an upper bound, and we treat it as one. Not every dollar of time and savings deposits can or should chase yield; some households knowingly accept a lower rate for a branch relationship, and a slice of the pool already earns more than 0.38%. But the direction and the scale are not in doubt. Even a conservative movable fraction of that balance leaves tens of billions of dollars on the table every year, concentrated in the accounts of people who never chose a low rate so much as never left one.
How we calculated it
The method is deliberately simple, so it can be checked.
- Deposit base. We use the Federal Reserve's FRED series TSDABSHNO, "Households and Nonprofit Organizations; Total Time and Savings Deposits" — $9,156,731 million ($9.157 trillion) as of the Q1 2026 observation. This series does not include checkable deposits; we do not add them, since mixing series would inflate the base beyond what any single dataset supports.
- Rate spread. We take the FDIC national-average savings rate, about 0.38%, as the default rate and a widely available high-yield rate near 4.0% as the alternative — deliberately below the single highest advertised rate, since a promotional or balance-capped outlier would overstate what a typical saver can actually lock in. The spread is 3.62 percentage points.
- Forgone interest. We apply the spread to the deposit base: $9.157 trillion × 3.62% = $331 billion ($9,156,731,000,000 × 0.0362 = $331,473,662,200, before rounding), which we round down and report as an estimated "$300 billion or more."
Limitations. This is an illustrative aggregate, not a claim that every household will or should move every dollar. Transactional balances, minimum-balance needs, and the reality that the national average includes some accounts already above 0.38% all argue for treating the figure as an upper bound. The per-household math below is the number most readers should act on.
Why the gap persists
If the money is insured and the better rate is a few clicks away, why does $9.157 trillion sit still? The evidence points to inertia rather than any rational tradeoff.
Start with awareness. Surveys find that about 43% of savers do not know the interest rate on their own account. You cannot act on a gap you cannot see, and a rate you never check is a rate you implicitly accept. Adoption follows the same pattern: roughly 82% of Americans do not use a high-yield savings account, per CNBC reporting, and about two-thirds of savers still earn less than 4% APY, according to a Bankrate survey.
None of this is a story about people making a considered choice to earn less. It is a story about default. The account was opened years ago, often at the bank with the nearest branch, and it has never been revisited. The balance does not fall, so nothing signals a problem. The loss is invisible precisely because it takes the form of money that never arrives.
That is what makes the idle-cash tax different from an ordinary expense. A visible cost gets attention. A number that simply fails to grow does not.
What it means for a household
The national figure is large enough to feel abstract, so bring it down to one balance.
A household keeping $25,000 in savings at the 0.38% national average earns about $95 a year. The same $25,000 at 4% earns about $1,000 a year. The gap is roughly $900, guaranteed, on federally insured money, for the effort of opening one account. On a $50,000 balance, the annual gap is closer to $1,810.
That is the number worth acting on. Not the aggregate, but your own balance times the spread between what you earn and what you could. It is one of the few improvements in personal finance that is both large and nearly risk-free, because the higher-yield account carries the same FDIC insurance as the one the money is sitting in now.
How we source this. Rates are sourced from primary institutions and the FDIC, not aggregated marketing pages, and are verified on a rolling basis; see our methodology and editorial team. This report was written by a former bank treasurer and reviewed by the SwitchWize Research Desk. We take no payment for organic rankings or citations.
Audit trail.
- Value
- $9,156,731 million ($9.157 trillion)
- Source
- Federal Reserve, FRED TSDABSHNO
- Source date
- Q1 2026 observation
- SwitchWize transformation
- None — exact figure used, not rounded
- Value
- 0.38%
- Source
- FDIC National Rates and Rate Caps
- Source date
- Re-verified live August 31, 2026
- SwitchWize transformation
- None
- Value
- 4.00%
- Source
- SwitchWize tracked institution set
- Source date
- Rolling
- SwitchWize transformation
- Deliberately below the single highest advertised rate to avoid a promotional outlier
- Value
- $331.5B ($331,473,662,200 exact), reported as "$300B or more"
- Source
- SwitchWize calculation
- Source date
- —
- SwitchWize transformation
- $9,156,731,000,000 × (4.00% − 0.38%), rounded down for the headline
- Value
- 82%
- Source
- CNBC Select
- Source date
- Published Aug. 1, 2025
- SwitchWize transformation
- None
- Value
- ~67% (two-thirds)
- Source
- Bankrate/YouGov survey
- Source date
- Fielded Feb. 20-23, 2024; published Mar. 27, 2024; n=3,581
- SwitchWize transformation
- None
- Value
- 43%
- Source
- LendingClub-commissioned, Talker Research-conducted survey
- Source date
- Oct. 2025, n=2,000
- SwitchWize transformation
- None
Sources
- Federal Reserve, Financial Accounts of the United States (Z.1); household and nonprofit time and savings deposits, FRED series TSDABSHNO.
- FDIC, National Rates and Rate Caps, national-average savings rate.
- CNBC Select, on high-yield savings adoption.
- Bankrate, Two-thirds of savers still earn less than 4% APY.
- LendingClub-commissioned survey conducted by Talker Research (2,000 respondents, October 2025).
Figures are current as of August 2026 and rounded. The forgone-interest estimate is a SwitchWize Research Desk calculation and an illustrative upper bound; see the methodology section above. This report and The State of American Cash use the same underlying FRED and FDIC sources and are kept in sync.
What to Do Now
Frequently Asked Questions
How much interest are Americans losing on idle cash?
What is the national average savings account rate in 2026?
Why do most Americans leave money in low-yield accounts?
Is moving cash to a high-yield account risky?
Act on this: today's top savings


Ranked by SwitchWize's composite score. We may earn a referral fee, and it never changes the ranking order.
Editorial review
What changed since the last update
Was this guide helpful?
Found an inaccurate, outdated, or missing claim? Report a correction. We verify reports against the relevant source before changing a guide or ranking.

Adeesh Setya is Head of Financial Research & Principal at SwitchWize, with 25+ years of experience in deposits, treasury management, banking products, and financial services. He previously served as Treasurer at Merrill Lynch Bank USA and Morgan Stanley Bank USA, where he managed bank funding, deposits, and interest-rate risk. He writes on Federal Reserve policy, the general marketplace for banking products, and what they mean for savers and consumers.
Available for on-record interviews, background briefings, and custom data cuts.
research@switchwize.com