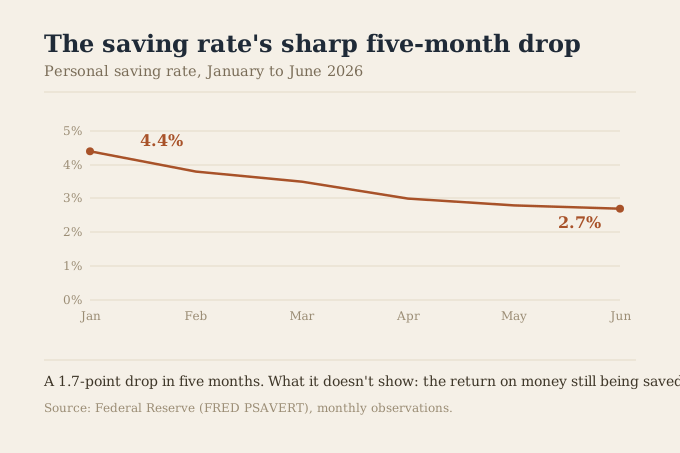
- The personal saving rate fell to 2.7% in June 2026, down from 4.4% in January, a sharp five-month decline and the second-lowest reading in SwitchWize's six-year tracked window.
- Press coverage has focused on the falling rate itself; the overlooked half of the story is that the money households do save mostly still sits in accounts paying a fraction of the widely available rate.
- A falling saving rate makes the return on existing savings matter more, not less, and closing that return gap takes no change in income or spending.
The personal saving rate fell to 2.7% in June 2026, down from 4.4% in January, a sharp five-month decline that's drawn real, warranted press attention. What's gotten less attention: even as the saving rate falls, the dollars households do manage to save mostly sit in accounts paying a small fraction of what's widely available, the same gap SwitchWize has documented at the national level for over a year. A shrinking saving rate makes that return gap matter more, not less. This report covers both halves. Figures last verified recently. Understanding the drivers behind the personal saving rate 2026 decline requires examining both behavioral and economic factors affecting household finances.
The numbers
- The rate. Personal saving rate: 2.7% in June 2026, per the Federal Reserve, down from 4.4% in January.
- The decline. A 1.7-percentage-point drop in five months, the second-lowest reading in the six years SwitchWize has tracked this series, behind only June 2022's 2.2%.
- The overlooked half. The FDIC national-average savings rate remains near 0.38% while widely available high-yield accounts pay close to 4%, a gap that doesn't shrink just because the saving rate does.
- The fix that doesn't depend on income or spending. Moving an existing balance to a top-paying account, which SwitchWize's companion report estimates recovers roughly $900 a year on a $25,000 balance.
Two different problems wearing one headline
"The saving rate fell" describes how much of each paycheck a household has left over to set aside after spending. It says nothing about what happens to the money once it is set aside. Those are genuinely separate questions with separate fixes: the first is a function of income, prices, and spending, largely outside a household's immediate control in a given month. The second, what interest rate that saved money earns, is almost entirely within a household's control and requires no change in either income or spending. Saving-rate coverage has understandably focused on the first question, since it's the more dramatic, more macro-relevant number. The second question is where SwitchWize's own research has consistently found the more actionable, more immediately fixable gap.
Why a falling rate raises the stakes on the second question
If the saving rate were rising, a low return on savings would still cost money, but a growing pool of savings would at least be growing. A falling saving rate means the opposite: the pool of savings households are building is smaller, which makes the rate of return on that smaller pool matter more to their overall financial position, not less. Every dollar that does get saved in a tighter month is doing more relative work toward whatever goal it's earmarked for, an emergency fund, a down payment, a cushion against the next surprise expense, and a dollar earning 0.38% is doing measurably less of that work than the same dollar earning 4%.
The scale of the return gap
SwitchWize's companion report on the state of American cash found that US households hold roughly $9.157 trillion in time and savings deposits at a national-average rate of 0.38%, while high-yield accounts pay close to 4% under the same FDIC insurance, an estimated $300 billion or more a year in interest that goes uncollected nationally. That gap exists independent of the saving rate: it's not that households are earning less because they're saving less; it's that most saved dollars, however many there are, sit in the wrong type of account. A falling saving rate doesn't create this problem. It does make the problem worth fixing sooner, since there's less room for a low return to be made up for by a larger pool of savings.
What actually depends on your state
For households paying meaningful state income tax, there's a second lever beyond a HYSA: Treasury income is exempt from state and local tax, so a Treasury-only money market fund can sometimes out-earn a savings account after tax, even at a lower headline rate. That comparison and the state-by-state math live in SwitchWize's companion deep-dive and its practical setup guide. In a no-income-tax state, the comparison is simpler: the highest-paying FDIC-insured account usually wins outright.
The honest counterargument
None of this addresses why the saving rate itself is falling, and this report doesn't attempt to. Inflation running above the Federal Reserve's target, elevated everyday costs, and softening consumer confidence are the widely reported drivers of the decline, and a household genuinely squeezed on cash flow each month can't switch-account its way out of that pressure. The point isn't that fixing where savings sit solves the saving-rate problem; it's that the two problems are frequently discussed as one when they call for entirely different responses, and the second one is fixable today regardless of what happens to the first.
Methodology
The personal saving rate figures (2.7% June 2026, 4.4% January 2026, 2.2% June 2022 low) are Federal Reserve data (FRED series PSAVERT) as tracked in SwitchWize's own database, covering a six-year window from mid-2020 forward; the series itself extends back to 1959, and widely reported historical context (a record low near 1.4% in 2005, a record high near 31.8% in April 2020) reflects that longer history as reported elsewhere, not SwitchWize's own verified window. National-average and high-yield savings rate figures, and the $300 billion aggregate forgone-interest estimate, are drawn directly from SwitchWize's own companion report rather than re-derived here, to avoid the two pieces drifting out of sync over time.
How we source this. Saving-rate figures are Federal Reserve data; deposit and rate-gap figures are SwitchWize's own tracked data, detailed in the linked companion report. See our methodology and editorial team. This report was written by a former bank treasurer and reviewed by the SwitchWize Research Desk. We take no payment for organic rankings or citations.
Sources
- Federal Reserve, Personal Saving Rate (FRED PSAVERT): monthly saving-rate data.
- SwitchWize, The State of American Cash: 2026 Report: national deposit pool, rate gap, and forgone-interest estimate.
Figures are current as of mid-2026. This page is informational, not financial advice. Free to cite with attribution to SwitchWize.
What to Do Now
Frequently Asked Questions
What is the personal saving rate in 2026?
Why has the savings rate dropped so much in 2026?
If the saving rate is falling, does the return on savings even matter?
How much am I losing by keeping my savings in a low-yield account?
What should I actually do if I'm struggling to save more right now?
The 5-minute money briefing
One email per week. New rates, fed moves, and what to actually do about them.
No spam. Unsubscribe anytime.
Act on this: today's top savings



Ranked by SwitchWize's composite score. SwitchWize currently has no compensated product links.
Editorial review
What changed since the last update
Was this guide helpful?
Found an inaccurate, outdated, or missing claim? Report a correction. We verify reports against the relevant source before changing a guide or ranking.

Adeesh Setya is Head of Financial Research & Principal at SwitchWize, with 25+ years of experience in deposits, treasury management, banking products, and financial services. He previously served as Treasurer at Merrill Lynch Bank USA and Morgan Stanley Bank USA, where he managed bank funding, deposits, and interest-rate risk. He writes on Federal Reserve policy, the general marketplace for banking products, and what they mean for savers and consumers.
Available for on-record interviews, background briefings, and custom data cuts.
research@switchwize.com