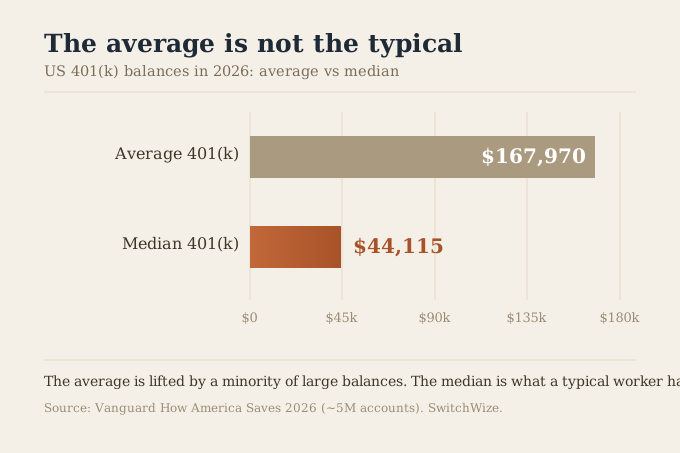
- Among Vanguard-administered 401(k) plans, the average balance hit a record $167,970 in 2026 (up 13% year over year), but the median is just $44,115 (up 16%): the average is inflated by a minority of large balances.
- The median is the real story. At a 4% withdrawal rate it produces about $147 a month, against the roughly $1.46 million many say they need.
- Median balances rise with age but stay modest, reaching about $107,269 for participants 55 to 64, and hardship withdrawals have climbed to about 6% of eligible participants, from under 2% before 2019.
Every year, a comforting number circulates: the average American retirement account is at a record high. In 2026 it is true again, at least among Vanguard-administered 401(k) plans: the average balance reached $167,970, per Vanguard's data on nearly five million accounts it directly administers. And every year it hides the same problem. The average is the wrong number to focus on. A minority of very large balances pulls it far above what a typical participant holds, and the honest figure, the median, tells a much harder story. This report is about that gap within Vanguard's own participant base, because the distance between the average and the median describes how prepared this large, real population looks versus how prepared it actually is; other providers' account populations report somewhat different levels, though the same large average-to-median gap. This page is reviewed by the SwitchWize Research Desk; the figures are sourced below with dates. Figures reflect Vanguard's most recent annual data release and were last checked August 9, 2026 — this is annual survey data, not a daily rate feed, so it updates once a year, not continuously. The average retirement savings 2026 figures highlight this misleading pattern, where headline numbers obscure the typical participant's actual financial readiness.
The numbers
Four figures define the landscape:
- The average. Among Vanguard-administered 401(k) plans, the average balance reached a record $167,970 in 2026, up 13% from year-end 2024, per Vanguard data.
- The median. The median balance, the true middle, is just $44,115, up 16% over the same period and roughly a quarter of the average.
- By age. Median balances rise but stay modest: about $2,234 under 25, and roughly $107,269 for participants 55 to 64.
- The stress signal. About 6% of eligible Vanguard participants took a hardship withdrawal in 2025, up from 5% in 2024 and from typically under 2% before 2019.
The single most important metric here is the distance between the first two. When an average is four times its median, the average is not describing most people; it is describing a distribution with a long tail of large balances at the top.
- Value
- $167,970
- Source
- Vanguard
- Value
- $44,115
- Source
- Vanguard
- Value
- ~$107,269
- Source
- Vanguard
- Value
- ~$147/mo
- Source
- SwitchWize calc
- Value
- ~6%
- Source
- Vanguard
Why the average lies
The gap between average and median is not a rounding quirk. It is what a skewed distribution looks like. A relatively small number of high earners and long-tenured savers hold very large balances, and those outliers pull the average up without touching the middle. The median ignores how large the biggest accounts are and simply reports the balance of the person in the exact center, which is why it is the honest measure of the typical participant in this population.
The practical takeaway is to distrust the reassuring average whenever you see it. A headline that "the average retirement account is at a record" is technically true and functionally misleading, because most participants are nowhere near it. The better comparison, for yourself or against this dataset, is the median.
What the median actually buys
Put the median through a withdrawal rate and the stakes become concrete. Fidelity puts a sustainable withdrawal rate at roughly 4% to 5% a year; we use the conservative low end. At a 4% withdrawal rate, the $44,115 median balance produces about $1,765 a year, or $147 a month, in retirement income. Against the roughly $1.46 million Americans believe they need to retire comfortably, per Northwestern Mutual's 2026 Planning & Progress Study (The Harris Poll, ~4,375 respondents, fielded Jan. 5-21, 2026), and against Fidelity's guideline of ten times your salary by 67, the median is not a small shortfall. It is a different order of magnitude.
Even for participants near retirement, the picture is sobering. The median balance for ages 55 to 64, about $107,269, produces roughly $4,300 a year at 4%. That is a meaningful supplement to Social Security, but far from a replacement for a paycheck. Social Security itself does end up carrying most of the load for a large share of retirees: benefits account for 50% or more of income for three in five beneficiaries aged 65 and older, per the Center on Budget and Policy Priorities' summary of Social Security Administration data.
The median is a benchmark, not your destiny. The calculator below projects where your own savings are likely to land, so you can measure against a real target rather than a national average:
Apply a deterministic planning score to withdrawal rate, stock allocation, and retirement horizon without claiming a simulation or success probability.
This heuristic uses 60% as its neutral scoring anchor. It is not a recommendation or a conclusion from a historical backtest.
Heuristic Readiness Score
87.5%
Use this result as one input in your broader Money Map, not as a one-off number.
What to do
Compare brokerage accounts
Pre-tax estimates. For illustration only — not financial advice.
The honest counterargument
A 401(k) balance is not a household's whole retirement picture, and it would be misleading to imply otherwise. Social Security replaces a meaningful share of pre-retirement income, especially for lower earners. Many households hold home equity, IRAs outside their workplace plan, pensions, or a spouse's accounts that these figures do not capture. And younger participants, who dominate the low end of the median, still have decades for balances to grow.
That is a real limitation of this dataset, and we do not have the household-level balance-sheet data, IRAs, pensions, home equity, spousal accounts, combined, to say precisely how much it changes the picture for a typical household. What the data here does support is narrower but still meaningful: within Vanguard's own participant base, the median 401(k) alone produces a small fraction of a comfortable retirement income, and Social Security was structured to supplement retirement income, not replace it, which is why it alone leaves most beneficiaries short of a full pre-retirement paycheck. The average overstates 401(k) readiness for this population; the median is the more honest number for what this specific dataset can tell you, and its limits are the reason to look at your own full financial picture rather than any single account balance.
One counterpoint deserves its own space rather than a caveat in passing: hardship withdrawals are rising, but not for a single simple reason. Vanguard attributes the rise since 2019 partly to the Bipartisan Budget Act of 2019, which eased the rules for accessing a hardship withdrawal, and partly to automatic enrollment pulling more lower-income workers into retirement plans in the first place, savers who are more likely to need that money before retirement. A rising hardship-withdrawal rate is a real signal of financial strain, but part of the increase reflects more people having a 401(k) to draw from at all, not only existing savers falling into distress at a higher rate.
Methodology
The average and median 401(k) balances and the by-age figures are from Vanguard's How America Saves data, which covers nearly five million accounts Vanguard directly administers, not a survey or estimate of the broader US workforce; other providers' account populations report somewhat different levels, but the same large average-to-median gap. Vanguard reports the average and median balances grew 13% and 16% respectively from year-end 2024, which we cite as trend context, not as our own calculation. The hardship-withdrawal rate (about 6% in 2025, up from 5% in 2024 and from typically under 2% before 2019) is specifically among participants eligible to take one, per Vanguard's own reporting convention; Vanguard attributes the post-2019 rise to the Bipartisan Budget Act of 2019 easing access rules and to automatic enrollment expanding participation among lower-income workers, not solely to worsening household finances. The income figures apply a 4% withdrawal rate to the reported balances; Fidelity states a sustainable withdrawal rate is generally 4% to 5% annually, and we use the conservative low end rather than a midpoint or upper bound. The $1.46 million "number to retire" is Northwestern Mutual's 2026 Planning & Progress Study, fielded by The Harris Poll January 5-21, 2026, a survey of what Americans believe they need, not a computed requirement. Because these figures reflect workers with a workplace plan at one large administrator, they understate the challenge for the many workers who have no workplace plan at all, and we do not have the combined-asset data (IRAs, pensions, home equity, spousal accounts, Social Security) needed to state a precise household-level shortfall; the honest-counterargument section above is explicit about that limit. A machine-readable version of these figures is published at /data/retirement-savings-gap.json. Nothing here is individualized financial advice.
How we source this. Balance data is Vanguard's own published report on its administered plans, the retirement-number survey figure is Northwestern Mutual's, the Social Security income-share figure traces to SSA data via CBPP, and the withdrawal math is standard, all cited with dates below. See our methodology and editorial team. We take no payment for organic rankings, and this report is free to cite with attribution.
Audit trail.
- Value
- $167,970
- Source
- Vanguard, How America Saves 2026
- Source date
- Year-end 2025, published Mar. 4, 2026
- SwitchWize transformation
- None
- Value
- 13%
- Source
- Vanguard
- Source date
- Published Mar. 4, 2026
- SwitchWize transformation
- None
- Value
- $44,115
- Source
- Vanguard, How America Saves 2026
- Source date
- Year-end 2025, published Mar. 4, 2026
- SwitchWize transformation
- None
- Value
- 16%
- Source
- Vanguard
- Source date
- Published Mar. 4, 2026
- SwitchWize transformation
- None
- Value
- $2,234
- Source
- Vanguard
- Source date
- 2026 report
- SwitchWize transformation
- None
- Value
- $107,269
- Source
- Vanguard
- Source date
- 2026 report
- SwitchWize transformation
- None
- Value
- 6% (2025), up from 5% (2024)
- Source
- Vanguard
- Source date
- Published Mar. 11, 2026
- SwitchWize transformation
- None
- Value
- Typically under 2%
- Source
- Vanguard
- Source date
- Published Apr. 25, 2025
- SwitchWize transformation
- None
- Value
- ~$147/mo
- Source
- SwitchWize calculation
- Source date
- —
- SwitchWize transformation
- $44,115 × 4% ÷ 12
- Value
- 4%-5% annually
- Source
- Fidelity
- Source date
- Current guidance
- SwitchWize transformation
- We use the 4% low end
- Value
- $1.46 million
- Source
- Northwestern Mutual, 2026 Planning & Progress Study (Harris Poll, n=4,375)
- Source date
- Fielded Jan. 5-21, 2026; published Apr. 1, 2026
- SwitchWize transformation
- None
- Value
- ≥50% of income for 3 in 5 beneficiaries
- Source
- Social Security Administration data, via Center on Budget and Policy Priorities
- Source date
- —
- SwitchWize transformation
- None
Sources
- Vanguard, How America Saves 2026: average, median, by-age, and year-over-year 401(k) balance figures, among Vanguard-administered plans only.
- Vanguard, How America Uses Hardship Withdrawals: the 6% (2025) vs. 5% (2024) hardship-withdrawal rate.
- Vanguard, Market Volatility and Lessons Learned: the pre-2019 hardship-withdrawal baseline and Vanguard's explanation for the post-2019 rise.
- Northwestern Mutual, 2026 Planning & Progress Study (conducted by The Harris Poll, fielded Jan. 5-21, 2026): the $1.46 million "number to retire" figure.
- Fidelity, retirement income sources: the 4%-5% sustainable withdrawal-rate range. Fidelity retirement guideline (ten times salary by 67).
- Center on Budget and Policy Priorities, Social Security Benefits Are Modest, summarizing Social Security Administration data on the share of retirement income Social Security provides.
- SwitchWize calculation applying a 4% withdrawal rate to the reported balances.
Figures are current for 2026 and reflect workers with a workplace retirement plan. This page is informational, not financial advice. Free to cite with attribution to SwitchWize.
Frequently Asked Questions
What is the average retirement savings in 2026?
What is the median 401(k) balance by age?
Is $44,115 enough to retire on?
Why is there such a big gap between average and median retirement savings?
How do I know if I am on track for retirement?
Answer a few questions about your situation and goals. Money Map points you to the highest-value next step across savings, mortgage, cards, and debt.
Editorial review
What changed since the last update
Was this guide helpful?
Found an inaccurate, outdated, or missing claim? Report a correction. We verify reports against the relevant source before changing a guide or ranking.

Adeesh Setya is Head of Financial Research & Principal at SwitchWize, with 25+ years of experience in deposits, treasury management, banking products, and financial services. He previously served as Treasurer at Merrill Lynch Bank USA and Morgan Stanley Bank USA, where he managed bank funding, deposits, and interest-rate risk. He writes on Federal Reserve policy, the general marketplace for banking products, and what they mean for savers and consumers.
Available for on-record interviews, background briefings, and custom data cuts.
research@switchwize.com