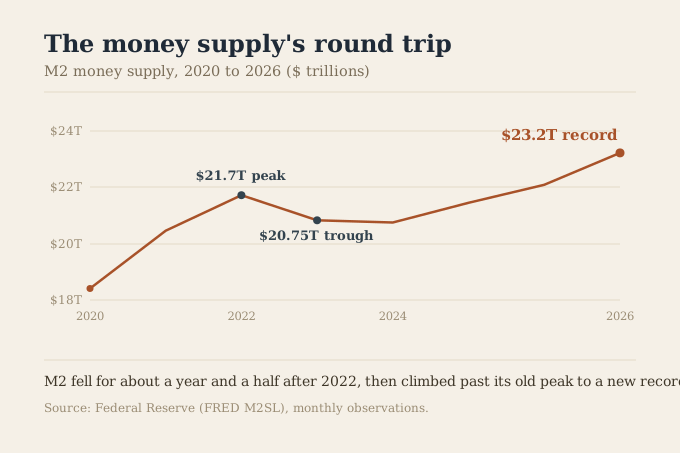
- M2 money supply hit a record $23.218 trillion in July 2026, finally surpassing its 2022 pandemic-stimulus peak.
- In between, M2 contracted outright for roughly a year and a half during 2022-2023, in SwitchWize's own tracked data, a rare event reported elsewhere as the first sustained M2 contraction since the 1930s.
- Growth has since reaccelerated to its fastest pace in years, which is one input economists watch for future inflation pressure, not a standalone forecast.
M2 money supply reached a record $23.218 trillion in July 2026, finally surpassing the peak it set during the 2020-2021 pandemic-stimulus expansion. What happened in between is the more interesting part: M2 fell outright for roughly a year and a half during 2022 and 2023, a genuinely rare event for a measure that grows most years by default. This report covers what actually happened to the money supply over the past several years and what a reaccelerating growth rate does and doesn't tell you. Figures last verified recently. Understanding the M2 money supply 2026 milestone helps explain how monetary policy shaped recent economic conditions for savers and borrowers alike.
The numbers
- The record. M2 money supply: $23.218 trillion in July 2026, a new high.
- The prior peak. About $21.7 trillion in mid-2022, at the top of the 2020-2021 stimulus expansion.
- The contraction. A trough near $20.75 trillion in late 2023, roughly a year and a half of outright decline from the 2022 peak.
- The reacceleration. Year-over-year growth widely reported near 5.6% as of May 2026, the fastest pace since July 2022.
A rare contraction, not just slower growth
M2 typically grows every year, since the economy itself grows and the money supply tends to expand alongside it. An actual, sustained decline is unusual enough that it's been widely reported as the first sustained M2 contraction since the 1930s. It followed one of the largest expansions on record: M2 surged more than 25% during 2020 and 2021, widely reported as the fastest pace since World War II, as pandemic-era stimulus and emergency Fed policy flooded the system with liquidity. The subsequent contraction, as the Fed raised rates and ran off its balance sheet to fight the inflation that followed, partially unwound that surge before growth resumed.
Why the reacceleration gets attention
The relationship between money-supply growth and inflation is real but looser than the simplest version of the theory suggests, since how quickly money actually circulates through the economy matters as much as how much of it exists. That's why a reaccelerating M2 growth rate doesn't function as a precise forecast. It is, however, one of the inputs economists and Fed watchers track, and the current pace, reported near 5.6% year-over-year as of May 2026, is a genuine acceleration from where growth sat immediately after the 2023 trough, worth noting rather than dismissing.
What this means for a saver, specifically
Nothing here changes the calculation a saver should already be running: compare your account's interest rate against inflation, not against zero, since the difference between the two is your actual, real return. If money-supply growth does eventually feed into higher inflation, as some economists watch for, the response doesn't change, it just becomes more urgent: an account earning a rate that isn't clearing inflation is losing purchasing power regardless of the nominal number on the statement, a dynamic SwitchWize has covered in its broader reporting on where American cash actually sits.
The honest counterargument
Money-supply-based inflation forecasting has a mixed track record, and several forecasters overweighted the 2020-2021 M2 surge in ways that arrived early or overstated the resulting inflation. Financial innovation and changes in how money moves through the economy have weakened the tight, mechanical link between M2 and prices that older economic models assumed. Treat the current reacceleration as a real, worth-watching data point precisely because it's verifiable and public, not because it settles the inflation debate on its own.
Methodology
M2 figures (the $23.218 trillion July 2026 record, the roughly $21.7 trillion mid-2022 peak, and the roughly $20.75 trillion late-2023 trough) are Federal Reserve data (FRED series M2SL) as tracked in SwitchWize's own database, covering a six-year window from mid-2020 forward. The 25%-plus 2020-2021 surge, the "first sustained contraction since the 1930s" characterization, and the 5.6% May 2026 year-over-year growth figure reflect widely reported external analysis of the same underlying FRED series and are cited as such rather than independently re-derived from SwitchWize's own six-year tracked window, which does not extend back far enough to verify the 1930s comparison directly.
How we source this. M2 levels within SwitchWize's tracked window are the Federal Reserve's own published data; longer-horizon historical characterizations are cited to external reporting on the same series. See our methodology and editorial team. This report was written by a former bank treasurer and reviewed by the SwitchWize Research Desk. We take no payment for organic rankings or citations.
Sources
- Federal Reserve, M2 Money Supply (FRED M2SL): monthly money-supply data.
Figures are current as of mid-2026 and update monthly as the Federal Reserve releases new data. This page is informational, not financial or investment advice. Free to cite with attribution to SwitchWize.
Frequently Asked Questions
What is M2 money supply and why did it hit a record high?
Why did M2 shrink in 2022 and 2023?
Does faster M2 growth mean inflation is coming back?
How does this affect my savings account or interest rate?
What's the difference between M2 growing and M2 growing too fast?
The 5-minute money briefing
One email per week. New rates, fed moves, and what to actually do about them.
No spam. Unsubscribe anytime.
Act on this: today's top savings



Ranked by SwitchWize's composite score. SwitchWize currently has no compensated product links.
Editorial review
What changed since the last update
Was this guide helpful?
Found an inaccurate, outdated, or missing claim? Report a correction. We verify reports against the relevant source before changing a guide or ranking.

Adeesh Setya is Head of Financial Research & Principal at SwitchWize, with 25+ years of experience in deposits, treasury management, banking products, and financial services. He previously served as Treasurer at Merrill Lynch Bank USA and Morgan Stanley Bank USA, where he managed bank funding, deposits, and interest-rate risk. He writes on Federal Reserve policy, the general marketplace for banking products, and what they mean for savers and consumers.
Available for on-record interviews, background briefings, and custom data cuts.
research@switchwize.com