- American households owe a record $18.8 trillion and spend about 11.2% of after-tax income servicing it, near the top of the range SwitchWize has tracked since 2019.
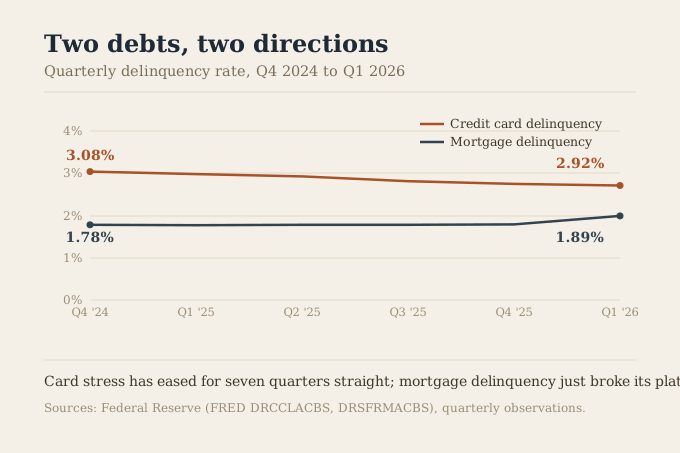
- Credit card delinquency has improved for seven straight quarters (3.22% to 2.92%), while mortgage delinquency was flat for five quarters, then jumped to 1.89% in Q1 2026, a move independently corroborated by the New York Fed's own serious-delinquency data.
- The debt getting the headlines is quietly getting healthier; the debt assumed to be safe is the one that just moved.
American households owe a record $18.8 trillion in total debt and spend about 11.2% of after-tax income servicing it, per the Federal Reserve and the New York Fed. The number underneath that headline is more useful: credit card delinquency has improved for seven straight quarters, while mortgage delinquency just broke a five-quarter plateau and moved up, a divergence confirmed by two independent Federal Reserve data sources. This report lays out both series with dates and sources. Figures last verified recently. These household debt statistics 2026 reveal a bifurcated landscape where borrowers are managing credit obligations better while facing renewed mortgage pressures.
The numbers
Four figures define the balance sheet:
- The total. US households owe $18.8 trillion, per the New York Fed's Household Debt and Credit Report for Q1 2026: $13.19T mortgages, $1.69T auto loans, $1.66T student loans, $1.25T credit cards, $446B HELOCs.
- The burden. The household debt-service ratio was 11.16% in Q1 2026, per the Federal Reserve (FRED TDSP), up from 11.11% a year earlier.
- The improving side. Credit card delinquency (FRED DRCCLACBS) fell to 2.92% in Q1 2026, down from a 3.22% peak in Q2 2024, seven straight quarters of improvement.
- The worsening side. Mortgage delinquency (FRED DRSFRMACBS) jumped to 1.89% in Q1 2026, after sitting flat near 1.77%-1.79% for the prior five quarters.
- Q1 2026
- $18.8 trillion
- A year earlier
- —
- Source
- New York Fed
- Q1 2026
- 11.16%
- A year earlier
- 11.11%
- Source
- Federal Reserve (TDSP)
- Q1 2026
- 5.88%
- A year earlier
- 5.76%
- Source
- Federal Reserve (MDSP)
- Q1 2026
- 2.92%
- A year earlier
- 3.06%
- Source
- Federal Reserve (DRCCLACBS)
- Q1 2026
- 1.89%
- A year earlier
- 1.77%
- Source
- Federal Reserve (DRSFRMACBS)
- Q1 2026
- $1.351 trillion
- A year earlier
- $1.302 trillion (+3.8%)
- Source
- Federal Reserve (REVOLSL)
Why the debt-service ratio is the number that matters
A dollar total tells you how much is owed. It says nothing about whether that debt is getting harder or easier to carry, because income and prices move too. The household debt-service ratio fixes that: it measures required debt payments as a share of after-tax income across the whole household sector. At 11.16%, it sits near the top of the range SwitchWize has tracked back to 2019 (a low of 9.05% in early 2021, when stimulus and forbearance temporarily lightened the load, and a high of 11.73% in late 2019, before the pandemic). Today's reading is not a record, but it is closer to the top of that range than the middle, and it has drifted up, not down, over the past year.
Split the ratio in two and the mortgage component explains most of the recent drift. The mortgage debt-service ratio (FRED MDSP) rose for four straight quarters, from 5.69% in Q4 2024 to a 5.92% peak in Q3 2025, before easing only slightly to 5.88% in Q1 2026, even though total mortgage-debt growth has been modest. That combination, a rising burden with muted balance growth, is what you would expect if the mortgage market is not adding many new borrowers so much as the existing stock is composed of fewer, far more expensive mortgages than a few years ago.
Two debt categories, two opposite directions
This is the finding that does not show up in the total. Credit card delinquency and mortgage delinquency have spent the past two years moving opposite ways, and it shows up on two separate Federal Reserve data series each.
On cards, the quarterly delinquency rate peaked at 3.22% in Q2 2024 and has fallen every quarter since, to 2.92% in Q1 2026. The New York Fed's own household-debt data, drawn from its Consumer Credit Panel rather than the bank-reported quarterly series above, shows the same direction through a different lens: the share of card balances newly transitioning into serious delinquency improved from 8.7% to 8.6% in Q1 2026. Two agencies, two methodologies, same conclusion: card stress, after a hard run from 2022 to 2024, is easing.
Mortgages went the other way. The quarterly delinquency rate sat essentially flat, between 1.77% and 1.79%, for five consecutive quarters, then jumped to 1.89% in Q1 2026, its largest single-quarter move in the window SwitchWize has tracked. The New York Fed's independent transition-into-serious-delinquency measure for mortgages corroborates it: that rate "accelerated slightly," in the Fed's own words, from 1.4% to 1.5% in the same quarter. Neither series alone would be conclusive. Both moving the same direction, from two different Federal Reserve data sources, is a real signal, not a data artifact in one dataset.
The honest counterargument
One quarter is one quarter, and 1.89% mortgage delinquency is still low by any historical standard, nowhere close to the 2008-2010 period. Mortgage credit quality since 2020 has generally been strong, underwritten at higher rates with more borrower equity than the pre-2008 market ever had. It is entirely possible this is a single-quarter blip that reverses next release, and the flat 1.77%-1.79% run that preceded it argues for some caution before calling it a trend.
What argues against dismissing it outright is the corroboration: the move shows up in two independently produced Federal Reserve datasets in the same quarter, not one series that could simply be noisy. Paired with a mortgage debt-service ratio that rose for four straight quarters before easing only slightly, the direction is at minimum worth tracking over the next release or two, which is a lower bar than calling it a crisis, and a higher one than ignoring it.
What it means for one household
The national ratio is a sector-wide average; your own is arithmetic. Add up what you pay monthly toward debt, mortgage or rent, cards, auto, student loans, personal loans, and divide by after-tax monthly income. A household bringing home $6,000 a month after tax and paying $670 toward debt is running the national-average 11.2%; the same household at $900 a month is running 15%, meaningfully more exposed to a rate shock, job loss, or expense surprise than the average the headlines describe.
Estimate a fee-inclusive consolidation-loan payment and rate comparison without claiming unknown current-debt savings.
New Monthly Payment
$457
Use this result as one input in your broader Money Map, not as a one-off number.
What to do
Compare Personal Loan Rates
Pre-tax estimates. For illustration only — not financial advice.
Methodology
The total-debt breakdown is the New York Fed's Household Debt and Credit Report for Q1 2026, drawn from its nationally representative Consumer Credit Panel/Equifax data. The debt-service ratios (TDSP, MDSP) and quarterly delinquency rates (DRCCLACBS, DRSFRMACBS) are separate Federal Reserve series, released quarterly and updated with a reporting lag, so a "Q1 2026" reading typically becomes available by mid-year; we use the most recent observation available in each series as of the verification date above. The revolving and total consumer-credit figures (REVOLSL, TOTALSL) are a third, monthly Federal Reserve series (the G.19 release) and are not the same measure as the New York Fed's credit-card balance figure above; the two use different methodologies and will not match exactly, which is expected and not an error. The 2019-2026 range cited for the household debt-service ratio reflects the full history available in SwitchWize's own tracked window, not the series' full history back to 1980, which runs both higher (over 13% in the mid-2000s) and lower than the range described here; we do not cite figures from outside our verified window.
How we source this. Debt totals are the New York Fed's; debt-service ratios and delinquency rates are the Federal Reserve's, both cited with series IDs and dates. See our methodology and editorial team. This report was written by a former bank treasurer and reviewed by the SwitchWize Research Desk. We take no payment for organic rankings or citations.
Audit trail.
- Value
- $18.8 trillion
- Source
- New York Fed, Household Debt and Credit Report
- Source date
- Q1 2026
- Value
- $13.19T / $1.69T / $1.66T / $1.25T / $446B
- Source
- New York Fed, Household Debt and Credit Report
- Source date
- Q1 2026
- Value
- 11.16% (vs. 11.11% a year earlier)
- Source
- Federal Reserve, FRED TDSP
- Source date
- Q1 2026 observation
- Value
- 5.88% (vs. 5.76% a year earlier)
- Source
- Federal Reserve, FRED MDSP
- Source date
- Q1 2026 observation
- Value
- 2.92% (peak 3.22% in Q2 2024)
- Source
- Federal Reserve, FRED DRCCLACBS
- Source date
- Q1 2026 observation
- Value
- 1.89% (flat 1.77%-1.79% for prior 5 quarters)
- Source
- Federal Reserve, FRED DRSFRMACBS
- Source date
- Q1 2026 observation
- Value
- Improved 8.7% to 8.6%
- Source
- New York Fed, Household Debt and Credit Report
- Source date
- Q1 2026
- Value
- Worsened 1.4% to 1.5%
- Source
- New York Fed, Household Debt and Credit Report
- Source date
- Q1 2026
- Value
- $1.351T (+3.8% YoY) / $5.167T (+2.4% YoY)
- Source
- Federal Reserve, FRED REVOLSL / TOTALSL
- Source date
- June 2026 observation
Sources
- Federal Reserve Bank of New York, Household Debt and Credit Report, Q1 2026 — total debt, category balances, and delinquency-transition rates.
- Federal Reserve, Household Debt Service Ratio (FRED TDSP) and Mortgage Debt Service Ratio (FRED MDSP).
- Federal Reserve, Credit Card Delinquency Rate, All Commercial Banks (FRED DRCCLACBS) and Single-Family Residential Mortgage Delinquency Rate (FRED DRSFRMACBS).
- Federal Reserve, Revolving Consumer Credit Outstanding (FRED REVOLSL) and Total Consumer Credit Outstanding (FRED TOTALSL), G.19 release.
Figures are current as of mid-2026 and reflect each series' most recent published quarter or month, which lag the calendar by design. This page is informational, not financial advice. Free to cite with attribution to SwitchWize.
What to Do Now
Frequently Asked Questions
How much debt do American households have in 2026?
What is the household debt-service ratio and why does it matter?
Why is credit card debt improving while mortgage debt is getting worse?
Is rising mortgage delinquency a warning sign for 2026?
How do I calculate my own debt-service ratio?
The 5-minute money briefing
One email per week. New rates, fed moves, and what to actually do about them.
No spam. Unsubscribe anytime.
Answer a few questions about your situation and goals. Money Map points you to the highest-value next step across savings, mortgage, cards, and debt.
Editorial review
What changed since the last update
Was this guide helpful?
Found an inaccurate, outdated, or missing claim? Report a correction. We verify reports against the relevant source before changing a guide or ranking.

Adeesh Setya is Head of Financial Research & Principal at SwitchWize, with 25+ years of experience in deposits, treasury management, banking products, and financial services. He previously served as Treasurer at Merrill Lynch Bank USA and Morgan Stanley Bank USA, where he managed bank funding, deposits, and interest-rate risk. He writes on Federal Reserve policy, the general marketplace for banking products, and what they mean for savers and consumers.
Available for on-record interviews, background briefings, and custom data cuts.
research@switchwize.com