- Americans owe about $1.69 trillion on their cars, and a record 30.9% of trade-ins are underwater, owing more than the car is worth by an average of $7,183.
- The mechanism is a trap: 84-month loans keep payments low but a car depreciates far faster than a long loan pays down, so borrowers spend years underwater.
- Rolling that negative equity into the next loan compounds it; the escape is a shorter term, a down payment, and keeping the car past payoff.
Auto debt in America has crossed $1.69 trillion, but the total is not the alarming part. Underneath it is a mechanism that turns a normal purchase into a compounding debt. To afford record car prices at 7% to 11% interest, buyers stretch their loans to seven years, but a car loses value far faster than a seven-year loan pays down. The result is that a record share of owners spend years owing more than their car is worth, and when they need a new one, they roll that gap into the next loan and begin deeper in the hole. This report lays out the numbers and the trap beneath them. This page is reviewed by the SwitchWize Editorial Team; the figures are sourced below with dates. Our car loan debt statistics 2026 analysis reveals how this cycle perpetuates across millions of American households.
The numbers
Four figures define the landscape:
- The debt. Americans owe about $1.69 trillion on auto loans, per the New York Fed, within a record $18.8 trillion of household debt.
- The underwater share. A record 30.9% of trade-ins toward new cars were underwater in early 2026, the highest since 2021, per Edmunds.
- The gap. The average negative-equity balance rolled into a new loan hit a record $7,183, and 26% of underwater trade-ins carried more than $10,000.
- The stretch. Among buyers with negative equity, 43% took an 84-month loan and about 90% stretched to 72 months or longer.
Put together, these describe a market where the loan increasingly outlives the value of the thing it bought. At new-car APRs near 7% and used near 11%, stretching the term to lower the payment multiplies the interest and lengthens the time spent underwater.
- Value
- ~$1.69 trillion
- Source
- New York Fed
- Value
- 30.9% (record)
- Source
- Edmunds
- Value
- $7,183 (record)
- Source
- Edmunds
- Value
- 43%
- Source
- Edmunds
- Value
- ~7% / ~11%
- Source
- 2026 market
Why long loans put you underwater
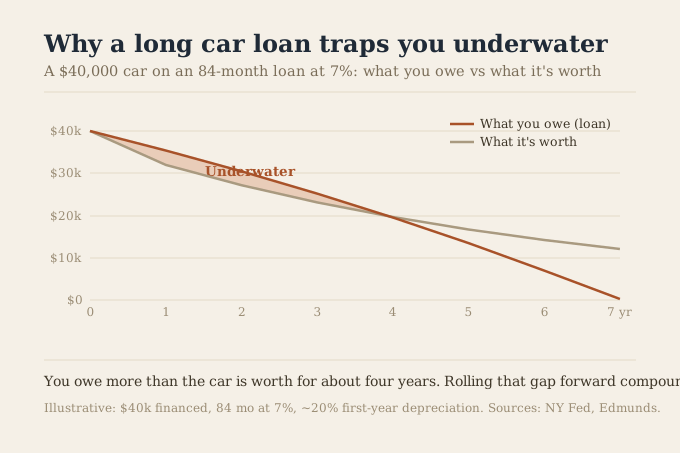
The trap is a race between two curves, and the borrower loses it. A car depreciates fastest early, losing roughly 20% of its value in the first year and continuing down from there. A long loan amortizes slowly, paying down little principal in the early years because most of each payment covers interest. Put the two together, as the chart above does, and the loan balance sits above the car's value for years. That distance is negative equity, and on an 84-month loan it can last around four years, most of the time you own the car.
Shorter loans win the race. On a 60-month loan with a down payment, the balance falls fast enough to stay near or below the car's value, so the owner builds equity instead of losing it. The single variable that most determines whether you end up underwater is the length of the term, which is exactly the variable a dealer adjusts to make a too-expensive car feel affordable.
The rollover trap
Negative equity would be a manageable, temporary condition if people kept their cars until the loan was paid off. The trap is that they often cannot, or do not. Over a seven-year loan, life intervenes, a growing family, a job change, a breakdown, and the driver needs a different car while still underwater on the current one. At that point the dealer offers to roll the negative equity into the new loan: add the $7,000 you still owe to the financing on the new car.
That single move is how one underwater loan becomes a cycle. The new loan starts thousands of dollars above the new car's value, on top of that car's own depreciation, so the borrower is immediately, and more deeply, underwater. Repeat it across a couple of trade-ins and the rolled-over debt compounds. See how your own numbers play out:
Estimate negative equity and a before-fees rollover-loan scenario.
Negative Equity
$5,000
Use this result as one input in your broader Money Map, not as a one-off number.
What to do
Compare auto loan rates
Pre-tax estimates. For illustration only — not financial advice.
What it costs one household
Bring it down to a purchase. A driver who rolls the average $7,183 of negative equity into a new 84-month loan is financing that gap at roughly 7% to 11% for seven years, adding well over a thousand dollars in interest just on the rolled-over portion, before the new car's own loan. Underwater buyers are already stretching: their average monthly payment has climbed to a record near $932. And because the term is so long, they will likely still owe money the next time they need to trade, setting up the next roll.
The alternative costs less at every step. Covering negative equity in cash, or better, keeping the car until it is paid off, ends the cycle. The math strongly favors the boring path: shorter loans, real equity before trading, and years of ownership with no payment at all.
Calculate total interest on an auto loan and the savings from extra monthly principal.
Total Interest
$6,498
Use this result as one input in your broader Money Map, not as a one-off number.
What to do
Plan your next move
Pre-tax estimates. For illustration only — not financial advice.
The honest counterargument
Not every borrower is caught in this. A buyer who makes a meaningful down payment, takes a 48- or 60-month loan, and keeps the car well past payoff builds equity and never goes underwater, and for them a car loan is an ordinary, manageable tool. Some drivers genuinely need to replace a vehicle and have no cheaper option than financing the gap. And a used car bought with a short loan can be a sound decision.
None of that changes the aggregate picture. The record 30.9% underwater share and the 43% reaching for 84-month terms show that the roll-and-extend path is not a fringe mistake; it is what a large and growing share of the market is doing, encouraged by how cars are sold. The trap is avoidable, but avoiding it requires declining the exact structure, longest term, lowest payment, trade whenever, that the transaction is designed around.
Methodology
The debt total is the New York Fed's quarterly household-debt figure for auto loans. The negative-equity share, average balance, rollover, and payment figures are Edmunds' early-2026 data on trade-ins toward new-vehicle purchases; quarter-to-quarter readings vary slightly, and we use the most recent record figures. APR ranges are 2026 market averages that depend heavily on credit and lender. A machine-readable version of these figures is published at /data/auto-debt-negative-equity.json. The depreciation-versus-amortization chart is an illustrative $40,000 vehicle financed over 84 months at 7% with roughly 20% first-year depreciation; your curve depends on the car, the term, and the rate, which is what the calculator is for. Nothing here is individualized financial advice.
How we source this. Debt totals are the New York Fed's; the negative-equity and loan-term figures are Edmunds'; APR ranges are 2026 market data, all cited with dates. See our methodology and editorial team. We take no payment for organic rankings.
Sources
- New York Federal Reserve, Household Debt and Credit Report: auto loan balances and total household debt.
- Edmunds, early-2026 negative-equity and loan-term data: underwater share, average negative equity, 84-month usage, and monthly payments.
- 2026 market averages for new and used auto-loan APRs (Experian, industry data).
Figures are current as of mid-2026 and vary by market, credit, and lender. This page is informational, not financial advice. Free to cite with attribution to SwitchWize.
Frequently Asked Questions
How much auto debt do Americans have in 2026?
What does it mean to be underwater on a car loan?
Why are 84-month car loans a trap?
Should I roll negative equity into a new car loan?
How do I avoid the auto debt trap?
Act on this: today's top auto



Ranked by SwitchWize's composite score. We may earn a referral fee, and it never changes the ranking order.
Editorial review
What changed since the last update
Was this guide helpful?
Found an inaccurate, outdated, or missing claim? Report a correction. We verify reports against the relevant source before changing a guide or ranking.
