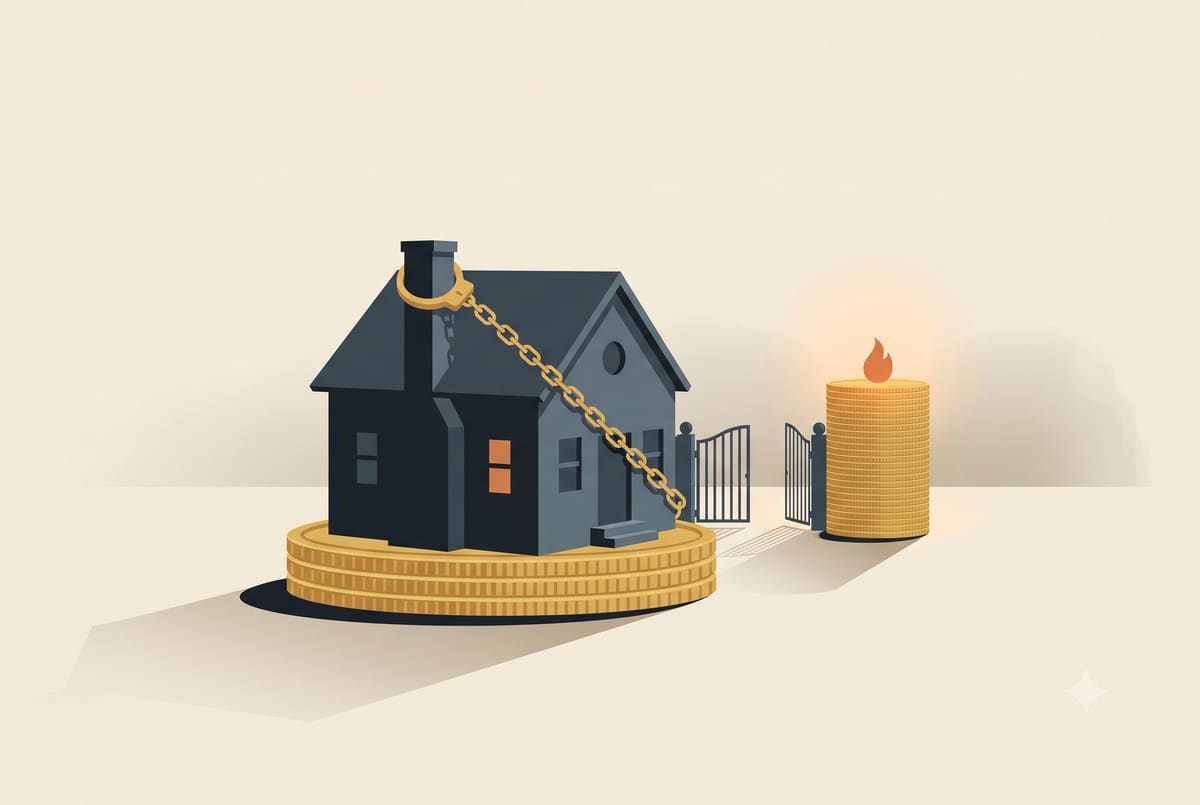
A homeowner with a 2.9% mortgage isn't just holding loan terms. Economically, they're holding an asset the market will never sell them again at that price, and new research shows they're treating it exactly like one.
The number that broke the model
In March 2024, four Federal Housing Finance Agency economists, Ross Batzer, Jonah Coste, William Doerner, and Michael Seiler, published a working paper with a finding stark enough to reorganize how housing economists think about the current market: for every percentage point a homeowner's market rate exceeds the rate they locked in at origination, the odds they sell in a given period fall by 18.1%.
Run that nationally and the paper estimates 1.33 million home sales that should have happened between mid-2022 and the end of 2023 simply didn't. Fewer homes for sale meant less competition pushing prices down: the researchers found the resulting scarcity added 5.7% to national home prices, more than offsetting the 3.3% price decline higher rates should have caused on their own. Higher rates were supposed to cool the housing market. Instead, by freezing supply harder than demand, they made it more expensive. The mechanism runs in a straight line: a higher Fed rate makes a new mortgage more expensive, which makes moving more expensive for anyone already holding a cheap one, which keeps existing homes off the market, which is what actually sets the price for the roughly 80% to 90% of U.S. housing transactions that are resales rather than new construction in any given year. The FHFA's own modeling projects the effect persisting out toward 2033 absent a sharp rate decline nobody is currently forecasting.
Two populations, same country
The setup is almost too clean. Rates under 3% during 2020–2021 look, in hindsight, less like a mortgage and more like a subsidy shaped like one. Then the Fed raised rates at the fastest pace in four decades, and mortgage rates followed past 7% at the 2023 peak, settling around 6.4%–6.6% by mid-2026, above 6% continuously since September 2022 and the longest stretch of that severity on record. As of Q2 2025, 52.5% of mortgage holders were still paying under 4%, per Federal Housing Finance Agency data tracked by Redfin. By Q3 2025, the share paying 6% or more (21.2%) passed the share still under 3% (20%) for the first time in five years. The country now has roughly as many homeowners locked into today's expensive money as it has locked into the pandemic's cheap money: one group trapped by what they'd lose leaving, the other by what they'd take on arriving.
The gap, isolated: a hypothetical $400,000 balance at 2.9% runs about $1,665 a month in principal and interest. The same $400,000 at 6.5% runs about $2,529: an extra $864 a month, roughly $10,400 a year, for the identical amount of house, before property tax or insurance.
Why your brain won't sell a good rate
None of this requires irrationality, just the same psychology people apply to everything else they own. In 1990, Daniel Kahneman, Jack Knetsch, and Richard Thaler ran a now-famous experiment: give someone a coffee mug and ask what they'd sell it for; ask someone else, mug-less, what they'd pay for one. The median seller wanted roughly twice what the median buyer offered. Merely owning the mug made it worth more in the owner's mind than it had been five minutes earlier as a hypothetical purchase. They called it the endowment effect, tracing it to the deeper asymmetry Kahneman and Amos Tversky had already identified: losing something hurts measurably more than an equivalent gain feels good.
Put a 2.9% mortgage through that lens and the "irrational" homeowner is running the standard human operating system as designed. The rate has become something they own, an asset with a market value they can calculate every time a friend mentions today's rate, and giving it up doesn't register as accepting a normal, historically unremarkable rate. It registers as a loss.
What homeowners actually say
A Bankrate/YouGov survey of nearly 2,300 adults found 54% of homeowners say there's no rate at which they'd feel comfortable selling this year, up 12 points from the year before; 41% of sub-3% holders said they wouldn't buy again at any rate. A separate Clever Real Estate/Best Interest Financial survey found 48% of sub-6% holders call themselves unwilling to give up their rate, and 35% wouldn't trade it "for any reason." The same survey found a generational split baked into who holds what: 47% of baby boomers sit on sub-4% rates versus 30% of millennials, meaning the households with the least remaining career and relocation runway are disproportionately holding the cheap money, while younger, more mobile households face full-price, full-rate math on anything they'd buy to replace it, including the ARM-versus-fixed tradeoff that gets more relevant the less permanent today's rate feels.
The most granular look at what staying actually costs people came from a 2026 survey of more than 3,000 Florida homeowners, reported by public radio station WLRN: 35% had delayed a major life decision specifically to avoid losing their rate, moving closer to family or downsizing for retirement among the top reasons. Asked how staying made them feel, the answers split: 32% said comfortable and 17% said lucky, but 9% said trapped, 8% said stuck in a home that no longer fits their life, and 27% described outright resentment. Fifteen percent said they'd accept a worse quality of life just to keep the rate. That's the endowment effect leaving theory and entering people's actual, lived unhappiness.
Is it loosening, and what actually breaks it
There's a fragile counter-trend: Redfin's head of economics research, Chen Zhao, put it plainly in late-2025 analysis: "More homeowners are deciding it's worth moving even if it means giving up a lower mortgage rate." A Redfin survey found 16% of homeowners now cite their rate as the single leading reason they're staying, a narrower question than the Bankrate and Clever numbers above but pointing the same direction. Mostly, though, the freeze is expected to thaw the way these things usually do: not because anyone changes their mind about the rate, but because life eventually forces the move regardless, whether that's a job change, a divorce, or a family that's outgrown a starter home. If you're weighing whether a move actually pencils out, run the real numbers before assuming the rate math rules it out, and check where current rates actually sit before deciding the gap is unbridgeable.
This article is educational and is not financial or mortgage advice. Figures and the illustrative $400,000 example above are detailed in the methodology note.
Quick answers
What is the mortgage rate lock-in effect? The tendency of homeowners with a mortgage rate well below today's market rate to avoid selling, because moving means financing a new home at a much higher rate. FHFA research ties every 1-point gap to an 18.1% drop in the odds a homeowner sells.
How many home sales has it prevented? FHFA researchers estimate roughly 1.33 million home sales that would otherwise have happened were prevented between mid-2022 and the end of 2023 alone, pushing national home prices up an estimated 5.7%.
How many homeowners does it affect? As of Q2 2025, 52.5% of mortgage holders had a rate under 4%. Independent surveys find roughly a third to half of homeowners with sub-6% rates say they're unwilling to give them up under any near-term scenario.
Will it ever end? FHFA modeling projects meaningful lock-in effects persisting out to 2033 absent a sharp rate decline. In practice, it's expected to fade gradually as life events force moves regardless of the rate, not through a broad shift in sentiment.
Connect the lesson
Turn the article into a next step.
SwitchWize takeaway
Find your number, not the market's.
Run a Money Map to see how your cash, debt, and rates stack up against the best available options.
Start Money Map →Figures are third-party research and survey data, not SwitchWize proprietary research: FHFA Working Paper 24-03 (Batzer, Coste, Doerner, Seiler, March 2024), Fonseca & Liu, "Mortgage Lock-In, Mobility, and Labor Reallocation," Journal of Finance (2024), Fonseca/Liu/Mabille's spatial housing-ladder model as summarized by Knowledge at Wharton, Redfin's rate distribution reports (Q2 2025 and Q3 2025), a Bankrate/YouGov mortgage sentiment survey, a Clever Real Estate/Best Interest Financial survey (Feb. 2026), and a Calgary Homes survey of Florida homeowners (2026, via WLRN). Reviewed July 8, 2026. The $400,000/2.9%-vs-6.5% example is an illustrative, hand-calculated hypothetical, not a real household.