- The 10-year minus 2-year Treasury spread turned positive in the fall of 2024, ending a period widely reported as the longest sustained inversion in modern US history.
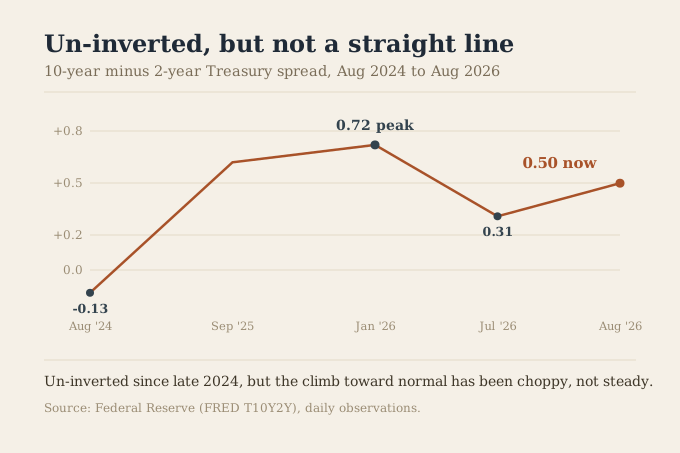
- The recovery hasn't been smooth: the spread peaked near 0.72 points in January 2026, fell to 0.31 by July, and sits at 0.50 now, still well below a historically 'normal' curve.
- A separate, shorter-maturity spread has reportedly flipped negative again even as this one stays positive, a divergence worth watching rather than a settled signal either way.
The 10-year minus 2-year Treasury spread turned positive in the fall of 2024, ending a stretch widely reported as the longest sustained yield curve inversion in modern US history. What's happened since is less widely covered: the recovery hasn't been a clean, steady climb back to a normal curve. It peaked near 0.72 percentage points in January 2026, fell to about 0.31 by July, and sits at 0.50 now, still well below what's historically considered a healthy spread. This report covers the actual shape of that recovery and what it does and doesn't tell you. Figures last verified recently.
The numbers
- The crossing. The 2-year to 10-year Treasury spread turned positive in the fall of 2024, per SwitchWize's own tracked data.
- The peak since. About 0.72 percentage points in January 2026.
- The recent dip. Down to about 0.31 by July 2026.
- Where it stands now. 0.50 as of August 21, 2026, still well below the roughly 1 to 1.5 points considered a historically normal curve.
Why "un-inverted" isn't the same as "normal"
An inverted curve, where short-term yields exceed long-term ones, is widely watched because it's historically preceded most recessions, though often with a long and variable lag. Crossing back to positive removes the inversion signal but doesn't automatically restore a "normal" curve. A healthy, positively sloped curve has often run in the range of 1 to 1.5 percentage points between the 2-year and 10-year; the current spread, around 0.50, sits well below that range. A curve that's technically positive but still narrow has been widely characterized elsewhere as a late-cycle pattern, distinct from either a deep inversion or a steep, comfortably positive curve.
The recovery hasn't been a straight line
The more specific, less widely reported part of the story is that this recovery has been choppy. After crossing into positive territory in the fall of 2024, the spread widened fairly steadily through 2025, reaching its widest point in SwitchWize's tracked window, 0.72 points, in January 2026. Since then it's fallen sharply, down to 0.31 by July, before partially recovering to 0.50 by late August. That back-and-forth reflects genuinely shifting expectations about the path of Fed policy, inflation data, and broader risk sentiment over the period, not a single clean transition from "inverted and worrying" to "normal and fine."
A second measure, reportedly diverging
Separately, a shorter-maturity spread, 3-month Treasury bills against the 10-year yield, has been reported elsewhere as flipping negative again in recent weeks even as the 2-year to 10-year spread SwitchWize tracks stays positive. SwitchWize has not independently verified this second series against its own data, so we report it as external reporting rather than a directly confirmed figure, but the divergence itself, one maturity pair positive while another goes negative, is a real pattern some analysts point to as a more nuanced signal than either measure alone.
What this means, and what it doesn't
The yield curve mainly matters for how longer-term rates (mortgages, long CDs) price relative to shorter-term ones (savings accounts, short CDs, the Fed's own policy rate). A narrow spread like the current one means the extra yield from locking money up longer, as a saver choosing a 5-year CD over a savings account, or a borrower comparing loan structures, is smaller than in a historically normal environment. It says less about the exact timing of any future recession than headlines built around a single inverted-or-not reading tend to suggest.
The honest counterargument
The yield curve's forecasting record, while real, is imperfect: it has produced false signals, and the lag between inversion and any subsequent downturn has varied enormously across cycles, from under a year to over two. The 2022-2024 inversion itself has already been un-inverted for roughly two years without the widely feared recession materializing on the timeline some forecasts implied when the inversion was at its deepest. Traders and economists still watch the curve because it remains one of the more reliable single indicators available, not because it's ever been a precise clock.
Methodology
The 2-year to 10-year Treasury spread figures (crossing positive in fall 2024, the 0.72 January 2026 peak, the 0.31 July 2026 low, and the 0.50 August 21, 2026 reading) are Federal Reserve data (FRED series T10Y2Y) as tracked in SwitchWize's own database, covering a two-year window from August 2024 forward. Characterizations of the 2022-2024 inversion's length and depth, and of the separate 3-month-to-10-year spread's recent behavior, reflect external reporting on the broader FRED dataset and are cited as such, since SwitchWize's own tracked window for this series does not extend back to the 2022-2024 inversion period and does not include the 3-month maturity at all.
How we source this. Yield curve figures within SwitchWize's tracked window are the Federal Reserve's own published data; longer-horizon and second-measure characterizations are cited to external reporting. See our methodology and editorial team. This report was written by a former bank treasurer and reviewed by the SwitchWize Research Desk. We take no payment for organic rankings or citations.
Sources
- Federal Reserve, 10-Year Treasury Minus 2-Year Treasury (FRED T10Y2Y): daily yield-spread data.
Figures are current as of late August 2026 and update daily as Treasury yields move. This page is informational, not financial or investment advice. Free to cite with attribution to SwitchWize.
What to Do Now
Frequently Asked Questions
Is the yield curve still inverted in 2026?
What does a positive but narrow yield curve mean?
Why did the yield curve un-invert unevenly instead of smoothly?
Does an un-inverted yield curve mean a recession isn't coming?
What does the yield curve mean for my mortgage or savings rate?
Act on this: today's top savings



Ranked by SwitchWize's composite score. We may earn a referral fee, and it never changes the ranking order.
Editorial review
What changed since the last update
Was this guide helpful?

Adeesh Setya is Head of Financial Research & Principal at SwitchWize, with 25+ years of experience in deposits, treasury management, banking products, and financial services. He previously served as Treasurer at Merrill Lynch Bank USA and Morgan Stanley Bank USA, where he managed bank funding, deposits, and interest-rate risk. He writes on Federal Reserve policy, the general marketplace for banking products, and what they mean for savers and consumers.
Available for on-record interviews, background briefings, and custom data cuts.
research@switchwize.com