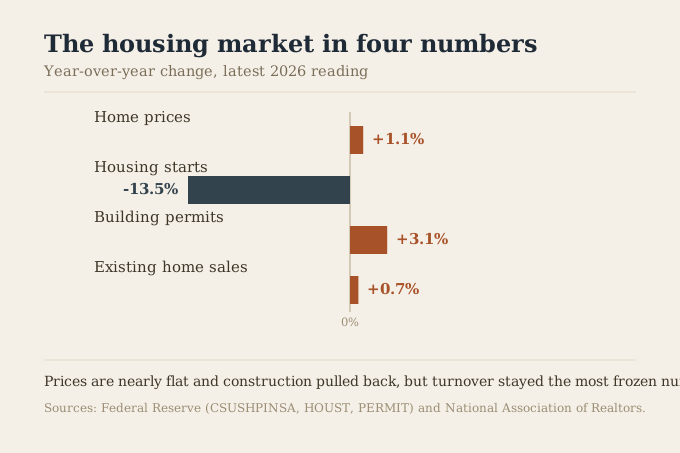
- Home prices rose just 1.1% year over year through May 2026, a sharp deceleration from 2021-2022's double-digit gains, but not a national decline.
- Housing starts fell 13.5% year over year while building permits rose 3.1%, a divergence consistent with builder caution rather than a shortage of approved projects.
- Existing home sales are stuck near a multi-year low (about 4.06 million annualized) because roughly half of sub-6%-rate homeowners say they will not give up that rate to sell.
National home prices rose 1.1% year over year through May 2026, a sharp deceleration from 2021-2022's double-digit gains, while housing starts fell 13.5% and existing home sales stayed stuck near a multi-year low of about 4.06 million annualized, per the Federal Reserve and NAR. The market is not crashing and not booming; it is stuck, cooling on price while turnover stays frozen. This report lays out the four numbers that actually describe it, each sourced with dates. This page is reviewed by the SwitchWize Editorial Team. Figures last verified recently. These housing market statistics 2026 reveal a market in transition, no longer defined by pandemic-era extremes but by persistent structural challenges.
The numbers
Four figures define the market:
- Prices. The Case-Shiller U.S. National Home Price Index rose 1.1% year over year through May 2026 (335.10, up from 331.41 a year earlier), per the Federal Reserve.
- New construction. Housing starts fell 13.5% year over year to a 1.239 million annualized pace in July 2026, down from 1.432 million, per the Federal Reserve.
- The builder signal. Building permits moved the other way, up 3.1% year over year to 1.443 million, per the Federal Reserve — more approvals, less actual groundbreaking.
- Turnover. Existing home sales ran at roughly 4.06 million annualized in July 2026, flat year over year (+0.7%) and still well below the pre-2022 norm of 5-6 million, per the National Association of Realtors.
- Latest (2026)
- +1.1%
- A year earlier
- —
- Source
- Federal Reserve (CSUSHPINSA)
- Latest (2026)
- 1.239 million
- A year earlier
- 1.432 million (-13.5%)
- Source
- Federal Reserve (HOUST)
- Latest (2026)
- 1.443 million
- A year earlier
- 1.400 million (+3.1%)
- Source
- Federal Reserve (PERMIT)
- Latest (2026)
- ~4.06 million
- A year earlier
- ~4.03 million (+0.7%)
- Source
- NAR (FRED EXHOSLUSM495S)
- Latest (2026)
- ~76%
- A year earlier
- —
- Source
- Clever Real Estate/Best Interest Financial, Feb. 2026
Prices are decelerating, not falling
A 1.1% annual gain is a very different market from the 15-20% annual gains of 2021 and parts of 2022. It is still growth, meaning the national index has not turned negative, but it is close enough to flat that it behaves like a plateau rather than an upward trend for most practical purposes: a buyer is not chasing a market moving away from them, and a seller who bought in the past year has very little cushion from appreciation alone. The national figure also smooths over real variation: some metros with heavier new supply have seen outright price declines over the past year, while a handful of supply-constrained markets are still appreciating well above the national pace. Treat 1.1% as the market-wide backdrop, not a substitute for checking your own metro.
Builders are hedging, not retreating
The starts-versus-permits divergence is the report's least-obvious finding. Housing starts, homes actually breaking ground, fell 13.5% year over year. Building permits, the approvals builders secure before they build, rose 3.1% over the same period. Permits typically lead starts by weeks to a few months, so a builder pulling more permits while starting fewer homes is a specific signal: they want the pipeline in place, land entitled and approvals secured, without committing capital to construction until demand, financing costs, or buyer traffic look more certain. It reads as caution and optionality, not as a builder retreat from the market entirely, and it is worth watching whether the permit growth eventually converts into starts or continues to sit on the shelf.
Why turnover is still frozen
Existing home sales are the number that has moved the least, and the reason is well documented: the mortgage rate lock-in effect. About 76% of mortgaged homeowners currently hold a rate below 6%, well under where new mortgages price today. Per a February 2026 survey of 1,000 mortgage holders by Clever Real Estate and Best Interest Financial, 48% of sub-6% holders say they are unwilling to give up that rate, 35% say not for any reason, and among the smaller group still holding a rate under 3%, that share climbs to 52%. Roughly 2 in 5 sub-6% holders say they would need rates below 4% before they would even consider selling. Each of those owners is a home that is not listed, which keeps national sales volume compressed regardless of how many buyers are looking. We cover the psychology and the research behind this mechanism in a companion report.
The honest counterargument
None of these are crisis numbers. Home prices are not falling nationally, mortgage delinquency (see our companion household-debt report) is low by historical standards, and a slower-appreciating market is arguably healthier than the 2021-2022 pace, which priced out a wide swath of buyers. Some metros are seeing real, welcome cooling after years of unaffordability. And building-permit growth, read generously, could simply mean builders are positioning for a demand pickup once rates ease, not signaling weakness.
The counterargument does not erase the turnover problem. A market where sales stay near a multi-year low for years running, even as prices hold up, is a market with a structural inventory constraint, not a temporary lull, and that constraint is unlikely to resolve until mortgage rates fall meaningfully or enough time passes that more owners' life circumstances force a sale regardless of rate.
Methodology
Home prices, housing starts, and building permits are Federal Reserve (FRED) series: CSUSHPINSA (Case-Shiller U.S. National Home Price Index, monthly, non-seasonally-adjusted, so year-over-year is the correct comparison rather than month-over-month), HOUST and PERMIT (both seasonally adjusted annual rates, monthly). Existing home sales (EXHOSLUSM495S) is the National Association of Realtors' series as republished by FRED; this series was restarted under a revised methodology, so SwitchWize's own verified comparison window only extends back to mid-2025, and we do not cite pre-restart historical figures from it directly. The 5-6 million pre-2022 "normal" reference for existing home sales is a widely reported market characterization, not a figure pulled from our own verified FRED window. The lock-in-effect survey figures are from Clever Real Estate and Best Interest Financial, fielded February 2026 among 1,000 US mortgage holders, published April 27, 2026.
How we source this. Price, starts, and permit data are the Federal Reserve's; existing home sales are NAR's; the lock-in survey is Clever Real Estate's, all cited with dates. See our methodology and editorial team. We take no payment for organic rankings.
Sources
- Federal Reserve, Case-Shiller U.S. National Home Price Index (FRED CSUSHPINSA).
- Federal Reserve, Housing Starts (FRED HOUST) and Building Permits (FRED PERMIT).
- National Association of Realtors, Existing Home Sales (FRED EXHOSLUSM495S).
- Clever Real Estate / Best Interest Financial, survey of 1,000 US mortgage holders (fielded Feb. 2026, published Apr. 27, 2026) — sub-6% and sub-3% rate lock-in figures.
Figures are current as of mid-2026 and vary by local market. This page is informational, not financial advice. Free to cite with attribution to SwitchWize.
What to Do Now
Frequently Asked Questions
Are home prices going up or down in 2026?
Why are housing starts falling while building permits are rising?
Why are existing home sales still so low in 2026?
What is the mortgage rate lock-in effect?
Is now a good time to buy a house?
The 5-minute money briefing
One email per week. New rates, fed moves, and what to actually do about them.
No spam. Unsubscribe anytime.
Act on this: today's top mortgage



Ranked by SwitchWize's composite score. SwitchWize currently has no compensated product links.
Editorial review
What changed since the last update
Was this guide helpful?
Found an inaccurate, outdated, or missing claim? Report a correction. We verify reports against the relevant source before changing a guide or ranking.
