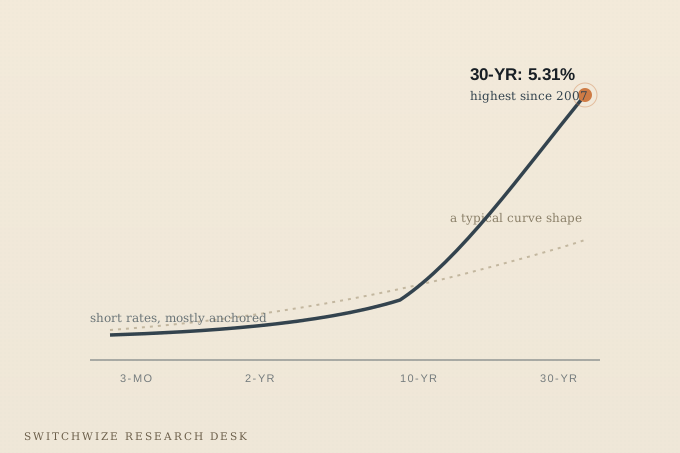
- The 30-year Treasury yield hit 5.31% on August 17, 2026, its highest close since July 2007, while the 10-year moved to about 4.71% the same day; the gap between those two moves is the real story.
- This is a bear steepening: long-term rates rising while short-term rates, the ones behind your credit card APR and your savings account, stay comparatively anchored. That is a different, more specific event than 'rates are rising,' and it changes what you should actually do about it.
- The clearest near-term effects land in four places: new mortgages get more expensive, existing bond and target-date fund holdings take a real paper loss, long-duration growth stocks face a higher discount rate, and cash sitting in a competitive account looks relatively better than it has in years.
Update, September 25, 2026: The record described below has already been broken again. The 30-year Treasury closed at 5.40% on September 23, 2026, and the 10-year at 5.11%, both higher than the August 17 levels this piece covers. At today's 5.40%, the more accurate comparison is the highest since July 2004, not 2007. The mechanism explained below (a long-end-led move, distinct from short-term rates) still holds and is still the right way to read the news; for the fuller current picture, including seven decades of history and what it means for locking in a Treasury today, see the 10-year Treasury's climb past 5% and what the rising term premium actually costs. One more change since August: short-term rates are no longer standing still. The Fed raised its target range by 0.25 point to 3.75% to 4.00% on September 16, its first hike since 2023, so savings and credit card rates are now moving up too. See what the September rate hike means for your savings.
On August 17, 2026, the yield on the 30-year Treasury bond closed at 5.31%. The last time it traded there, it was July 2007. Two Bear Stearns hedge funds full of mortgage debt had just collapsed, the word "subprime" was only starting to enter household vocabulary, and the crisis that would define the next decade had not been named yet. Nineteen years is long enough that most people reading this have never managed their own money with the long end of the curve looking like it does right now. The 30-year Treasury yield highest since 2007 represents a dramatic shift in borrowing costs that touches nearly every American's financial life.
None of that has to stay abstract for long. The 30-year Treasury does not sit in most people's portfolios directly, but its yield is one of the reference points lenders, insurers, and pension funds use to price a mortgage quote, an annuity, and the discount rate on a company's future earnings. When it moves this much this fast, the effects show up in ordinary financial lives within weeks, not years.
What just happened
The chart below is not a dramatic story. It is a plain one, and that is what makes it worth looking at directly.
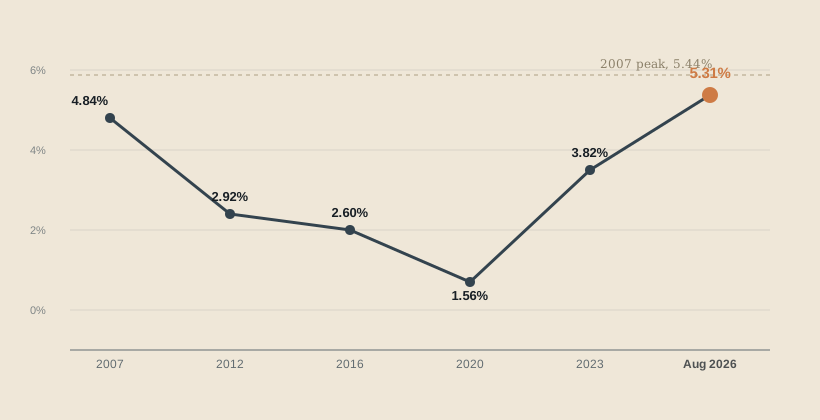
Three things are doing most of the work in that climb back up. First, the federal government is issuing an enormous and growing volume of long-term debt to fund persistent deficits, and more supply means the Treasury has to offer a better price to clear the market. Second, that supply is now competing directly with a wave of corporate bond issuance from companies borrowing heavily to fund AI infrastructure and data centers, pulling from the same pool of buyers. Third, inflation has stayed stickier than hoped, with tariffs and energy costs keeping pressure on prices, and the market is demanding a larger term premium, the extra yield investors want for the risk of holding government debt for three decades, to compensate.
A separate piece breaks down whether the 30-year's yield is actually worth locking in as an investment: the term premium math on a 30-year Treasury. That is a narrower question about a specific bond purchase. This is a broader one: what does a move like this actually do to you, whether or not you own a single Treasury.
The rate you don't see isn't the rate you feel
Here is the part most coverage skips past. "Interest rates are rising" is not one event, it is at minimum two, and they are not moving together right now. The federal funds rate, the short-term lever the Fed controls directly, sits at 3.75% to 4.00%, and that is what mostly drives your credit card APR, your savings account yield, and a new auto loan. The 30-year Treasury is priced by the market, not the Fed, on an entirely different set of expectations about deficits, inflation, and decades of risk.
When the long end rises faster than the short end, as it has this year, traders call it a bear steepening. What it means for you: your high-yield savings account is not suddenly paying less because of this news, and your credit card APR did not move either. But your bank pays about 0.38% on average right now, and the best high-yield accounts pay closer to 4.27%, a gap that has nothing to do with this week's Treasury move and everything to do with which bank you happen to use. Conflating the two, treating "rates are up" as a single undifferentiated fact, is exactly how people miss where the real, actionable gap actually is.
What this actually touches
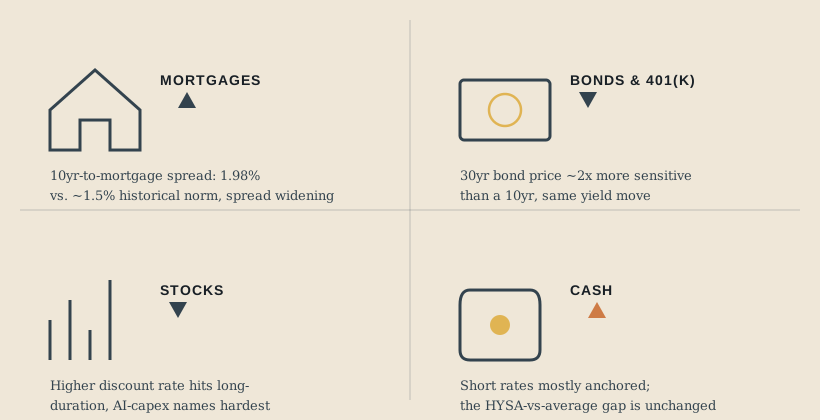
Mortgages and home buying are the most direct line. The 30-year fixed mortgage rate tracks the 10-year Treasury more closely than the 30-year, with lenders adding roughly 1.5 to 2 percentage points of risk premium on top. That spread is currently running wide, near 1.92 percentage points as of late September, above its historical norm, so mortgage rates are rising for two reasons at once: the Treasury move itself, and lenders pricing extra caution beyond it. The average 30-year mortgage sits around 7.03% as a result. If you are shopping for a home or weighing a refinance, this is not background noise. It is the number that determines your monthly payment.
Bonds and retirement accounts you already own are the quieter casualty. If your 401(k) or IRA holds a target-date fund, a bond index fund, or anything with meaningful duration, you likely took a real, visible loss on paper this month. Bond prices move inversely to yields, and the longer the maturity, the bigger the swing.
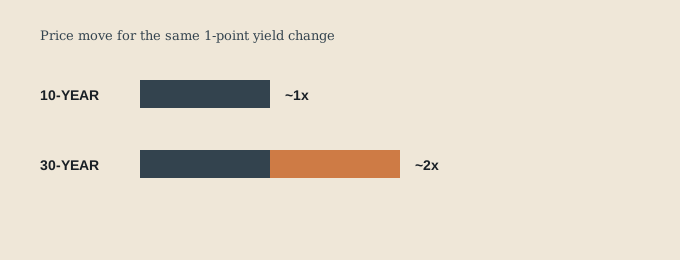
This is not a reason to sell into the loss. It is a reason to understand why the number on your statement moved, and to check how much duration risk you are actually holding before you react to it.
Stocks, especially the ones priced on a distant future, feel it through a different mechanism. Higher long-term yields raise the discount rate used to value a company's future cash flows, and that hits growth and AI-infrastructure names hardest, the ones whose value depends most on earnings many years out. It also raises the bar: a nominally risk-free 30-year Treasury paying over 5% is real competition for capital that used to flow automatically into equities.
Cash, for once, looks relatively good. Because this is a bear steepening and not a broad rate spike, short-term instruments, savings accounts, money markets, short Treasury bills, have not moved down with the news. Relative to the risk you would take reaching for yield in a long bond or a richly priced stock right now, sitting in a competitive high-yield account is one of the more rational places to be for money you will need in the next few years.
What to do about it
If you are buying a home or refinancing in the next few months, run the math at today's actual rate, not last year's, and use a real amortization calculator rather than a rule of thumb. Our mortgage calculator does this with live rate data, and the refinance breakeven calculator will tell you honestly whether a refinance actually pays for itself at today's spread.
If you hold bond funds or a target-date fund inside a 401(k), look up its average duration before deciding whether the recent dip is noise or a real allocation problem. Where to keep your cash walks through the short-duration alternatives if you decide you want less of this exposure.
And if you have cash sitting in an account paying close to the national average while the best accounts pay meaningfully more, this is a strange month to leave that gap on the table. Our Bank Gap Index tracks that spread daily, and Money Map will size the actual dollar difference for your own balance.
None of that requires a view on where the 30-year goes next. It only requires knowing what is actually true about your own accounts today. A 19-year high is a genuinely rare event. What happens with the next two months is the part actually within your control.
Source: S&P Capital IQ Pro; SNL Financial Data. Calculations: FDIC. Reflects the $2,500 product tier for savings and interest checking accounts.
Frequently Asked Questions
Why did the 30-year Treasury yield hit its highest level since 2007?
Does a higher 30-year Treasury yield mean my savings account rate went up too?
Should I sell my bond funds or target-date fund after this?
What should I do after reading Treasury Yields Just Hit Their Highest Since 2007. Here Is What Actually Changes For You.?
The 5-minute money briefing
One email per week. New rates, fed moves, and what to actually do about them.
No spam. Unsubscribe anytime.
Answer a few questions about your situation and goals. Money Map points you to the highest-value next step across savings, mortgage, cards, and debt.
Editorial review
What changed since the last update
Was this guide helpful?
Found an inaccurate, outdated, or missing claim? Report a correction. We verify reports against the relevant source before changing a guide or ranking.
