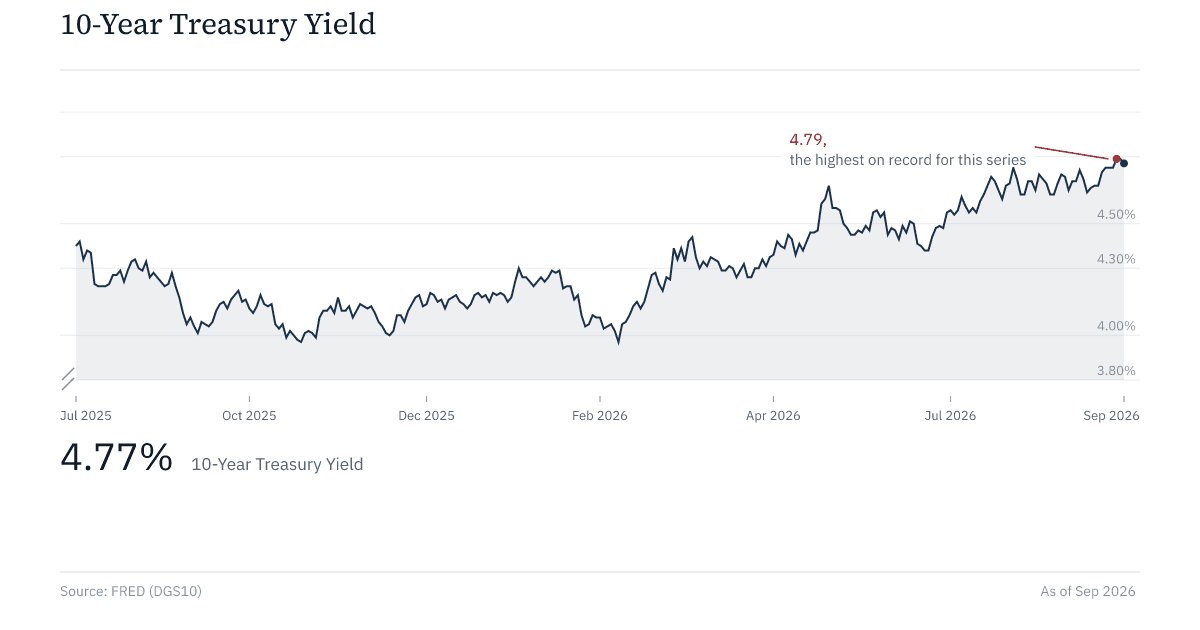
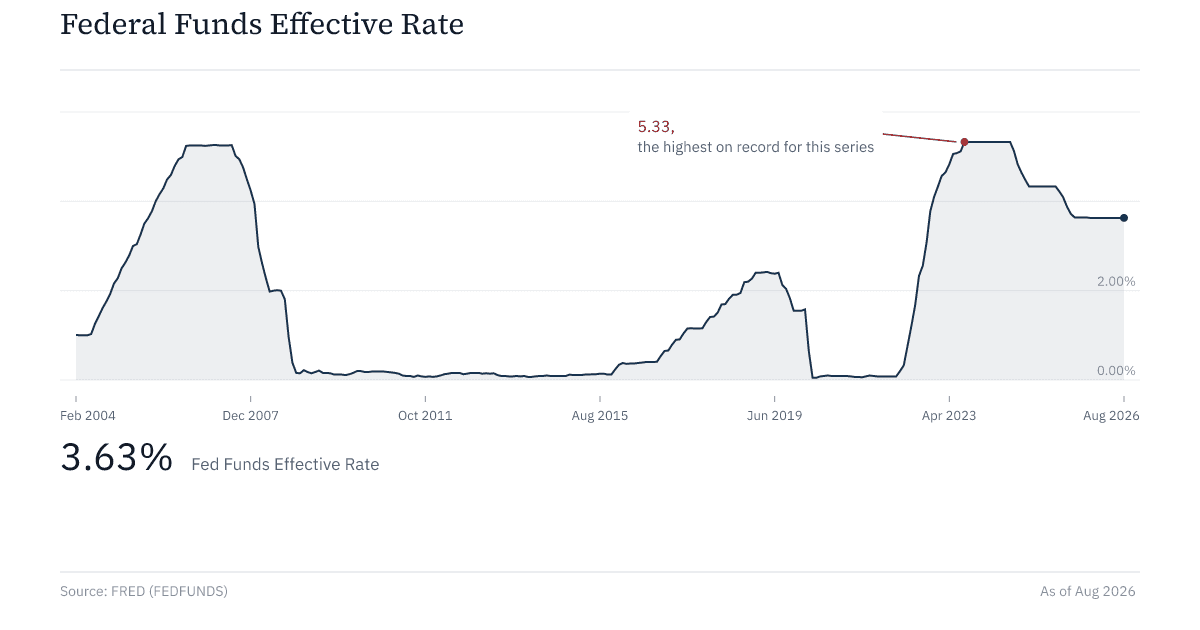
- The 10-year Treasury yield closed at 4.77% on September 3, 2026, the highest reading in SwitchWize's tracked history back to mid-2025, while the Fed funds rate has fallen to 3.63% from a 5.33% cycle peak over the same stretch -- short rates down, long rates up, relative to the policy rate.
- The Treasury curve itself didn't move uniformly: the 2-year and 5-year yields rose more (65 and 57 basis points) than the 10-year and 30-year (37 and 33 basis points), so the 2s10s spread actually narrowed from 71 to 43 basis points -- a belly-led rise, not the simple 'long end runs away' story a generic rates explainer would tell.
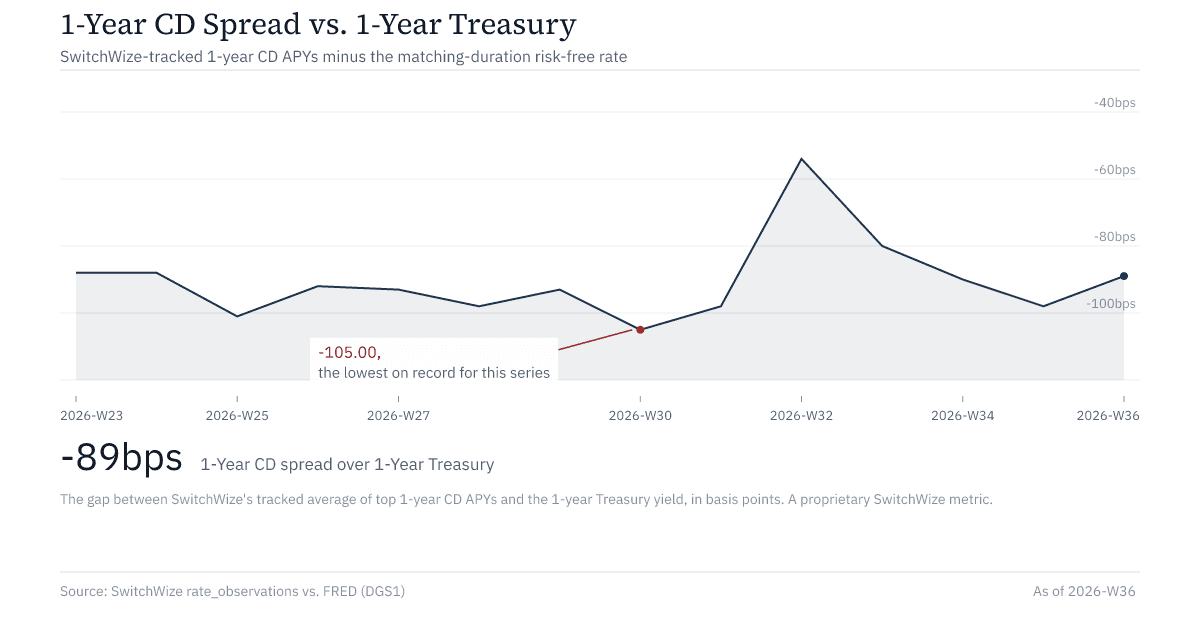
- SwitchWize's own tracked rate data -- not available from any public survey -- shows banks have not passed this move through to CD pricing: top 1-year CD APYs are averaging about 90 basis points under the matching 1-year Treasury, and top 5-year CDs are running about 189 basis points under the 5-year Treasury, a gap that widened across the 14 weeks tracked.
- This is a proprietary-data companion to SwitchWize's earlier coverage of the August yield spike: that piece explained the initial move across mortgages, 401(k)s, and stocks; this one tracks what changed since, and quantifies, in real tracked basis points, exactly what it means for cash sitting in a CD or savings account.
In August 2026, the 30-year Treasury yield hit its highest level since 2007. SwitchWize covered that move when it happened: a bear steepening on the day, long-term yields spiking while short-term rates, the ones behind your savings account, stayed comparatively anchored. That piece explained the mechanism behind a single milestone day. This one tracks the weeks since, using data nobody else publishes: exactly how much is your bank actually paying you relative to the Treasury yield of the same duration, right now, in real tracked basis points -- and is that gap getting better or worse.
It's gotten worse. Specifically at the 5-year term, and specifically not by a small amount. And the curve's own shape, once you look past the single day of the August spike, turns out to be more interesting than "steepening."
The curve, updated -- and it's not a simple steepening
As of September 3, 2026, the picture has moved since that August milestone. The 10-year Treasury yield climbed to 4.77%, a fresh high for SwitchWize's tracked window, while the 30-year actually eased back slightly to 5.25% from its August 17 peak of 5.31%.
Meanwhile the Fed funds effective rate sat at 3.63% in August 2026, down substantially from the 5.33% peak of the last hiking cycle. Short policy rates down, long Treasury yields up -- that part of "the 2026 rate breakout" is real and it's the headline-friendly version of the story.
But looking only at the Fed funds rate versus the 10-year misses what actually happened inside the Treasury curve itself, and it's not the tidy "long end runs away" picture that phrase usually implies. Comparing every maturity SwitchWize tracks at the start of this window against today:
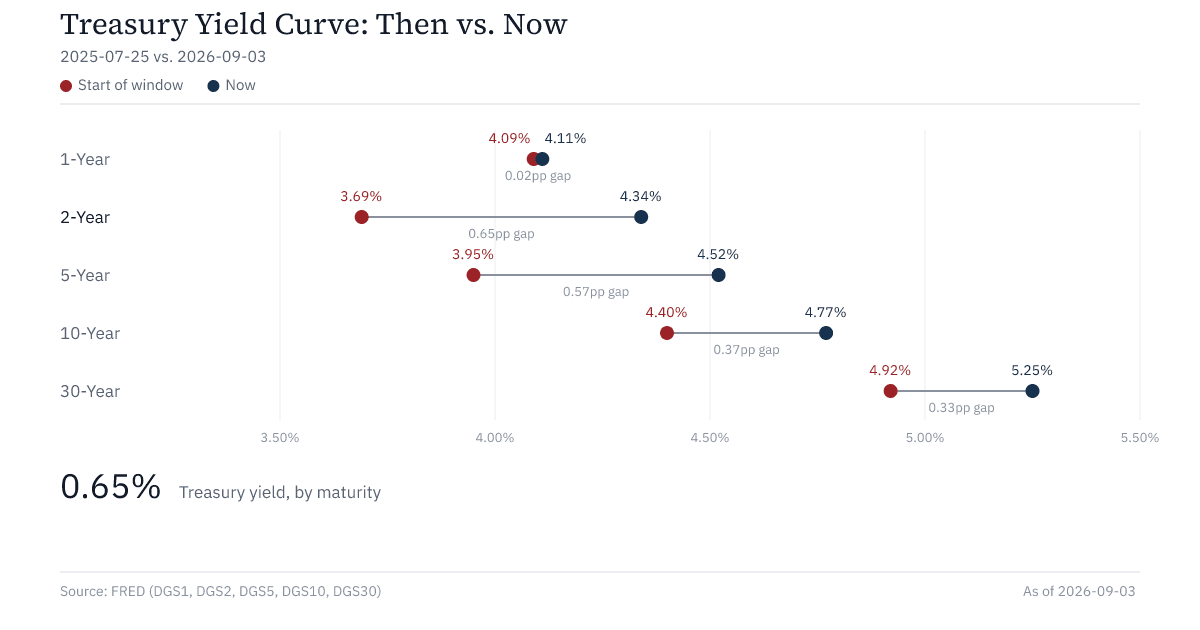
The 2-year and 5-year yields climbed the most -- 65 and 57 basis points -- more than the 10-year's 37 and the 30-year's 33. The 1-year barely moved at all (2 basis points). That's a belly-led rise: the middle of the curve did the work, not the long end. One consequence worth being precise about, since "bear steepening" gets used loosely: the 2s10s spread (10-year yield minus 2-year yield) actually narrowed over this window, from 71 basis points to 43, and the 2s30s spread narrowed from 123 to 91. From 2 years out to 30, the curve modestly flattened even as every point on it rose in level. The steepening that's real here is relative to the policy rate falling underneath all of it, not a reshaping of the Treasury curve's own slope.
The part nobody else can show you: what banks are actually paying
Here's the section that separates this piece from a general "rates are moving" explainer: SwitchWize tracks advertised CD APYs across roughly 70 providers directly, which means we can compute an actual, week-by-week spread between what a real, top-available CD pays and what the matching-duration Treasury pays over the same period -- not a one-time snapshot, a real time series.
Over the 14 weeks tracked through early September 2026, the average top 1-year CD APY moved from about 3.00% to 3.22%, while the 1-year Treasury moved from about 3.88% to 4.11% over the same span. The gap -- the actual number that matters if you're deciding between a CD and a Treasury -- has held remarkably steady around 90 to 100 basis points under Treasury the entire time, with one anomalous week (late July) where it briefly narrowed to 54 basis points on unusually thin observation coverage that week, not a real market move.
The 5-year comparison tells a more pointed story. Top 5-year CD APYs averaged only about 2.60% to 2.63% across the tracked weeks, against a 5-year Treasury yield that climbed from 4.43% to 4.52% over the same stretch -- a gap of 183 to 189 basis points, and one that widened, not narrowed, as the Treasury yield rose. Banks simply did not pass the move through at the 5-year term. If you're holding cash for five years and comparing a bank CD against a Treasury note of the same maturity, the bank CD is the more expensive way to lend your own money right now, by a growing margin.
- SwitchWize-tracked top CD APY
- 3.22%
- Matching Treasury yield
- 4.11%
- Spread
- -89 bps
- SwitchWize-tracked top CD APY
- 2.63%
- Matching Treasury yield
- 4.52%
- Spread
- -189 bps
Latest tracked week (week of September 6, 2026 for 1-year; week of August 30, 2026 for 5-year -- the two series' most recent available weeks differ slightly based on scrape cadence).
A high-yield-savings-vs-3-month-Treasury version of this same analysis is planned but isn't populated yet -- see the methodology note above for exactly why, rather than us estimating it here.
What Damodaran calls the "intrinsic" rate, and what we can and can't say about it yet
Aswath Damodaran's own framing for a riskfree rate is that it should equal expected inflation plus expected real growth -- a check on whether the market's actual rate is running ahead of or behind what the real economy can justify. Building that exact calculation for the U.S. right now needs two ingredients: trailing CPI inflation and trailing real GDP growth, combined by year. SwitchWize's CPI series is populated (the index closed at 332.813 in July 2026, up from a base of 186.3 in January 2004), but the real GDP series needed to compute the growth half of that equation was added to our data pipeline this month and hasn't completed its first historical backfill yet. Rather than approximate the growth term from a public headline figure and call it our own analysis, we're holding this section until the real number is in the database -- and will update this piece when it is, rather than publish a placeholder as if it were tracked data.
Brief market context
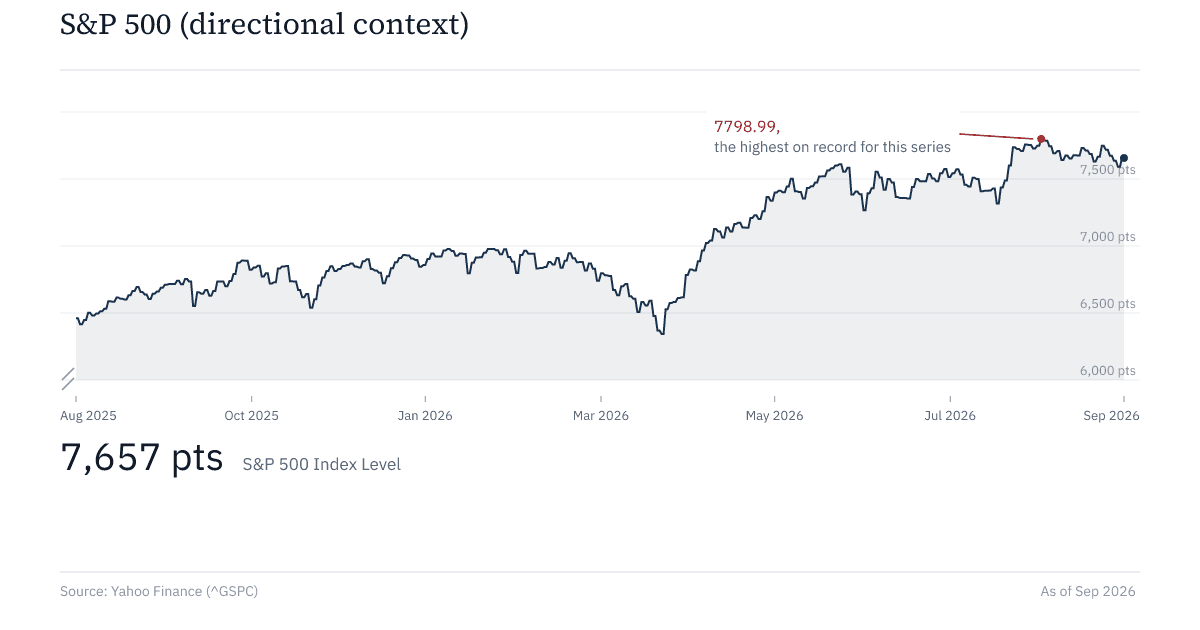
The S&P 500 closed at 7,656.98 on September 11, 2026, up from 5,595.76 two years earlier -- a roughly 37% total gain over the window, though the index has pulled back slightly from an all-time tracked high of 7,798.99 reached earlier in the period. This is directional context only, not a claim about which sectors or companies drove the move; SwitchWize does not track company- or sector-level equity data, and building that out would need a paid data feed, which is a deliberate scope decision, not an oversight (see the SwitchWize product backlog for the open item).
What this means for you
If you're holding cash and comparing your options in this environment, the tracked data above says something fairly specific: a 1-year Treasury is paying roughly 90 basis points more than a top bank's 1-year CD right now, and a 5-year Treasury is paying nearly 190 basis points more than a top bank's 5-year CD, with that second gap still widening. On a $25,000 five-year allocation, a 189 basis point annual gap is roughly $470 a year left on the table by choosing the CD over the Treasury -- before accounting for the fact that Treasury interest is also exempt from state and local income tax, which would widen the real, after-tax gap further in most states.
That doesn't mean a CD is never the right call -- FDIC insurance, predictable liquidity terms, and simplicity are real, legitimate reasons some savers prefer one -- but it does mean the "safe cash" decision isn't a wash the way it might have felt a few years ago when Treasury yields and CD rates tracked each other more closely. How much that matters depends heavily on what the cash is actually for:
If you're building or holding an emergency fund, the gap this piece tracks mostly doesn't apply to you directly -- a high-yield savings account, not a CD or a Treasury note, is the right instrument, because you need the money liquid on short notice, not locked into a term. The relevant comparison for you is the Bank Gap Index piece's tracked gap between an average bank's savings rate and a top-available one, not this piece's CD-vs-Treasury spread.
If you're laddering CDs for retirement income, the 5-year gap is the one to look at closely. A 189 basis point annual shortfall compounds across every rung of a multi-year ladder, and a Treasury ladder built from notes bought directly (or through a brokerage account) captures the state-tax exemption on top of the higher headline yield -- both of which matter more the larger the ladder. The tradeoff working the other way is simplicity and a single, familiar institution; a Treasury ladder built and held to maturity is not meaningfully riskier than a CD ladder, but it does ask you to manage more moving pieces yourself.
If you're a higher-balance saver parking a large short-term allocation -- proceeds from a home sale, a bonus, a business distribution -- the 1-year spread of about 90 basis points on a six- or seven-figure balance is a real, calculable dollar amount well worth running through a calculator before defaulting to whatever CD your existing bank happens to offer. The size of the balance is exactly what makes a basis-point gap stop being a rounding error.
If you're managing a more complex balance sheet -- multiple accounts, tax considerations across brackets, a mix of goals -- the CD-vs-Treasury comparison here is one input among several, and the after-tax math in particular is worth running with an actual advisor rather than from this article's general numbers, since state tax treatment varies enough to change the answer.
The data
Every series behind this piece -- the full Treasury yield history, the Fed funds series, the week-by-week CD spread data, and the S&P 500 context series -- is available as a downloadable spreadsheet, the same way Aswath Damodaran links his own underlying datasets alongside his posts: Download the full data pack.
What to Do Now
Sources
- FRED, 10-Year Treasury Constant Maturity Rate (DGS10) -- 4.77% as of September 3, 2026.
- FRED, 30-Year Treasury Constant Maturity Rate (DGS30) -- 5.25% as of September 3, 2026, down from an August 17, 2026 close of 5.31%.
- FRED, 2-Year and 5-Year Treasury Constant Maturity Rate (DGS2, DGS5) -- used for the yield-curve-shift comparison and the 2s10s/2s30s spread figures.
- FRED, Federal Funds Effective Rate (FEDFUNDS) -- 3.63% as of August 2026.
- SwitchWize rate_observations (proprietary) -- top advertised CD APYs across roughly 70 tracked providers, weekly average, weeks of 2026-06-08 through 2026-09-06.
- Yahoo Finance, S&P 500 (^GSPC) historical chart data -- daily close, September 2024 through September 2026, directional context only.
This article is educational, not individualized financial advice, and is not a recommendation to buy or sell any specific Treasury security, CD, or other financial product. Rate figures are dated snapshots as cited and will drift from current conditions over time; the SwitchWize-tracked spread figures reflect averages across observed providers during the cited weeks, not a rate available to every individual saver. Treasury interest is generally exempt from state and local (though not federal) income tax; CD interest is generally not. Consult a tax professional about your own situation before making a decision based on the after-tax comparison referenced above.
Connect the lesson
Turn the article into a next step.
SwitchWize takeaway
Find your number, not the market's.
Run a Money Map to see how your cash, debt, and rates stack up against the best available options.
Start Money Map →Treasury and Fed funds figures are drawn from FRED (Federal Reserve Economic Data): DGS1, DGS2, DGS5, DGS10, DGS30, and FEDFUNDS, backfilled weekly into SwitchWize's own database. The proprietary CD-vs-Treasury spread is computed by SwitchWize from its own rate_observations data (top advertised CD APYs across roughly 70 tracked providers, bucketed by ISO week and averaged) against the FRED Treasury yield of matching duration for that same week; only weeks where both a product observation and a Treasury reading exist are shown, so gaps in the underlying scrape history appear as gaps in the chart rather than an interpolated line. The yield-curve-shift comparison uses each maturity's first and most recent reading in SwitchWize's tracked window (starting mid-to-late July 2025), not a single-day snapshot. The S&P 500 series is sourced from Yahoo Finance's public chart data and is directional context only -- SwitchWize does not track sector- or company-level equity data. A parallel high-yield-savings-vs-3-month-Treasury spread and a full CPI-plus-real-GDP "intrinsic rate" series are planned but not yet populated as of this publication; both depend on FRED series (3-month Treasury, real GDP) added to SwitchWize's backfill this month that have not yet completed their first historical load. This piece will be updated once that data is available rather than estimating it.