- An I bond bought in October 2026 earns 4.26% for its first six months, but its 0.90% fixed rate stays with it for up to 30 years. That fixed rate is the only part of the rate you lock in.
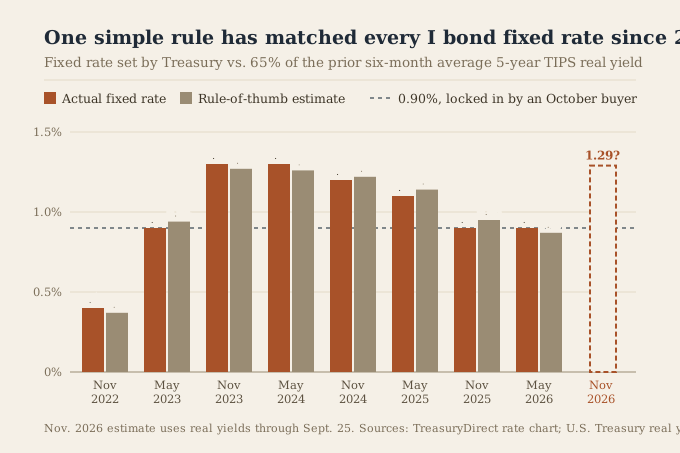
- One rule of thumb, 65% of the average five-year TIPS real yield over the prior six months, has matched every I bond fixed rate since November 2022. With real yields up sharply since the September 16 Fed hike, it points to about 1.30% for November.
- On $10,000 held 10 years, a 1.30% fixed rate instead of 0.90% is worth about $600, assuming 3% inflation. For a one- or two-year hold, buying in October or November makes little difference.
Buying I bonds before the November 1, 2026 reset only makes sense if you expect to cash them out within a year or two. The purchase keeps today's 4.26% rate for six months, but it also locks in a 0.90% fixed rate for as long as you own the bond, and Treasury's own yield data points to a fixed rate near 1.30% for bonds bought from November.
Joel, 58, is the kind of buyer this decision catches. He has $10,000 from a CD that matured in September and a note on his calendar to buy I bonds "before the rate drops on November 1." Joel is a composite, but his reasoning is common: one widely read investing site urged readers this month to buy before the November 1 reset. The headline rate is what he's watching. The number that will follow his bond for up to 30 years is a different one.
What an I bond actually is
A Series I savings bond is a U.S. government savings bond, bought directly from the Treasury at TreasuryDirect.gov, not through a bank or brokerage. Like a savings account, it never loses dollar value. Unlike a savings account, its rate is built to track inflation: it resets every six months based on how fast consumer prices are moving, so it's designed to keep pace with the cost of living rather than lag behind it the way a fixed-rate account can.
That rate is really two rates stacked together, and confusing them is the easiest way to misjudge these bonds. The inflation rate is the part that moves. It resets every six months based on the Consumer Price Index, so it climbs when prices are rising fast and falls when they cool off. The fixed rate is the part that never moves. Whatever fixed rate comes attached to your bond on the day you buy it stays with that specific bond for as long as you hold it, for up to 30 years, regardless of what happens to inflation, interest rates, or anything else afterward.
That's also why a "higher" fixed rate is worth caring about, even though the numbers themselves look small. The fixed rate is how much your money is guaranteed to grow faster than inflation, for as long as you hold the bond. A 0.90% fixed rate means your buying power grows about 0.90% a year above whatever inflation turns out to be, for up to 30 years, no matter what the Fed does or where the stock market goes in between. A 1.30% fixed rate does the same job, just faster. Over a year or two the gap between the two is a few dollars. Held for a decade or three, it compounds into a real cushion, which is exactly what the dollar figures later in this piece measure.
One more thing worth knowing before the mechanics: the fixed rate isn't set at random, and it just jumped for a real reason. It tends to track a related number the bond market prices every day: the real yield on Treasury Inflation-Protected Securities, or TIPS, a different type of government bond that trades on the open market. When investors demand a bigger cushion above inflation to hold a government bond, TIPS yields rise, and the I bond's fixed rate has historically followed within a reset or two. That's what's happening now, following the Fed's September 16 rate hike, which is the news event behind this piece. The next few sections show exactly how tight that link has been, and what it points to for November.
What an October purchase actually locks in
An I bond's rate has two parts. The fixed rate is set on the day the bond is issued and never changes. The inflation rate resets every six months from the bond's issue date, based on the Consumer Price Index. TreasuryDirect combines them into one composite rate: fixed rate, plus twice the six-month inflation rate, plus a small cross term.
Bonds issued from May 1 through October 31, 2026 carry a 0.90% fixed rate and a 1.67% six-month inflation rate, which gives the 4.26% composite. A bond Joel buys in October earns 4.26% until April 2027. After that, it earns whatever the inflation rate is at the time, plus 0.90%, for the rest of its life. The 4.26% is a six-month rate. The 0.90% is permanent.
How the fixed rate has moved since 2000
The fixed rate has ranged from 0% to 3.60% over the bond's history. Per the TreasuryDirect rate chart, it was 3.60% for bonds bought from May to October 2000. It drifted down through the 2000s and hit 0.00% again and again in the 2010s, including five straight six-month periods from May 2020 to October 2022, the stretch when I bonds became famous for a 9.62% composite rate that was all inflation and no fixed rate.
It climbed back as interest rates rose: 0.40% in November 2022, 0.90% in May 2023, then 1.30% in November 2023 and May 2024, the highest since 2007. It has slipped since: 1.20%, then 1.10%, then 0.90% in each of the last two resets. Anyone who bought in late 2023 locked in 1.30% for life. Anyone who bought during 2020 to 2022 locked in zero.
How Treasury appears to set the fixed rate
The Treasury has never published a formula for the fixed rate. But the fixed rate has a close cousin: the real yield on five-year Treasury Inflation-Protected Securities, or TIPS, which is the return above inflation the bond market demands on a five-year government bond. Both are government promises of a return on top of inflation, so it makes sense they move together.
The Tipswatch newsletter, which tracks inflation-protected investments, uses a simple rule: take the average five-year TIPS real yield over the six months before a reset, multiply by 0.65, and round to the nearest tenth (Tipswatch, Aug. 9, 2026). We tested that rule against the Treasury's own daily real yield curve for every reset since 2022. It matched all eight.
- Avg. five-year real yield, prior six months
- 0.57%
- 65% of that
- 0.37%
- Actual fixed rate
- 0.40%
- Avg. five-year real yield, prior six months
- 1.45%
- 65% of that
- 0.94%
- Actual fixed rate
- 0.90%
- Avg. five-year real yield, prior six months
- 1.96%
- 65% of that
- 1.27%
- Actual fixed rate
- 1.30%
- Avg. five-year real yield, prior six months
- 1.93%
- 65% of that
- 1.26%
- Actual fixed rate
- 1.30%
- Avg. five-year real yield, prior six months
- 1.87%
- 65% of that
- 1.22%
- Actual fixed rate
- 1.20%
- Avg. five-year real yield, prior six months
- 1.75%
- 65% of that
- 1.14%
- Actual fixed rate
- 1.10%
- Avg. five-year real yield, prior six months
- 1.46%
- 65% of that
- 0.95%
- Actual fixed rate
- 0.90%
- Avg. five-year real yield, prior six months
- 1.33%
- 65% of that
- 0.87%
- Actual fixed rate
- 0.90%
Where the November fixed rate is heading
Real yields have risen hard this year. The five-year TIPS yield was 1.42% on January 5, 2026, 2.13% on August 7, and 2.64% on September 25, after the Fed's September 16 hike and its signal that more may follow. The 10-year TIPS yield reached 2.85% on September 24, per the same Treasury data.
The average since May 1 is 1.98%. Multiply by 0.65 and you get 1.29%, which rounds to 1.30%. That would tie November 2023 as the highest fixed rate since 2007.
With about three weeks of trading left before a typical announcement, a drop to 1.20% would take a big move. For the rule to round down to 1.20%, the five-year real yield would need to average about 1.54% from now through October 20, a full point below where it sits today. The upside is closer. If the five-year yield stays near its September 25 level of 2.64% through mid-October, the six-month average lands almost exactly on the line between 1.30% and 1.40%. Any further rise tips the rule to 1.40%, which would be the highest fixed rate since 2006.
Where this estimate could be wrong
The rule is an outsider's fit to the Treasury's past choices, not the Treasury's own method. It has matched eight resets in a row, but the Treasury can set any fixed rate it wants, and a different Treasury team could weight things differently. Treat 1.30% as the likeliest outcome, not a known number.
The timing argument also weakens for short holds. The October buyer keeps 4.26% for six months. What a November buyer earns in the first six months depends on the September inflation reading, which comes out October 14:
- November six-month inflation rate
- 1.44%
- November composite at 1.30% fixed
- 4.20%
- October buyer's rate from April 2027 at 0.90% fixed
- 3.79%
- November six-month inflation rate
- 1.55%
- November composite at 1.30% fixed
- 4.42%
- October buyer's rate from April 2027 at 0.90% fixed
- 4.01%
- November six-month inflation rate
- 1.65%
- November composite at 1.30% fixed
- 4.62%
- October buyer's rate from April 2027 at 0.90% fixed
- 4.21%
- November six-month inflation rate
- 1.75%
- November composite at 1.30% fixed
- 4.82%
- October buyer's rate from April 2027 at 0.90% fixed
- 4.42%
The CPI-U index was 330.213 in March and 334.980 in August, per the Bureau of Labor Statistics, a 1.44% rise. A year ago the September index rose about 0.25% from August. If September is flat, a November buyer starts slightly below 4.26%. In every other row, the November buyer earns more from day one.
What the gap is worth in dollars
For a longer hold, the fixed rate matters most. We modeled $10,000 in each bond, using a 1.65% inflation rate for the November bond's first six months, then 3% yearly inflation for both, with interest added every six months as TreasuryDirect does:
- October bond, 0.90% fixed
- $12,159
- November bond, 1.30% fixed
- $12,401
- Difference
- $242
- October bond, 0.90% fixed
- $14,759
- November bond, 1.30% fixed
- $15,355
- Difference
- $596
- October bond, 0.90% fixed
- $21,746
- November bond, 1.30% fixed
- $23,542
- Difference
- $1,796
- October bond, 0.90% fixed
- $32,040
- November bond, 1.30% fixed
- $36,094
- Difference
- $4,053
If November's fixed rate comes in at 1.40%, the 10-year gap grows to about $749. If Joel cashes out after one year instead, the difference either way is roughly $25, depending on the September and March inflation readings. After two years it is still under $100.
Both bonds count toward the same limit. The $10,000 yearly cap on electronic I bonds runs by calendar year, so buying in November or December still uses Joel's 2026 allowance. Waiting costs him a month, not a year of room.
When buying in October still makes sense
October is reasonable for money you expect to cash out in one to two years. The bond can't be redeemed at all for 12 months, and cashing it before five years costs the last three months of interest, per TreasuryDirect. Over that short window, the fixed rate barely matters.
For money that will stay put five years or longer, the fixed rate is the part you keep. A November purchase is likely to lock in about 0.40 point more for life.
If you do buy in October, don't wait until the last day. TreasuryDirect sets the issue date by the month it receives your funds, and its FAQ warns that a purchase made at the end of a month may get the next month's issue date. October 31, 2026 is a Saturday.
If you might need the money within a year, an I bond is the wrong tool in either month. The best savings accounts we track pay up to 4.20% and let you withdraw any day. Compare current rates on our savings rate table, and see our I bonds vs. high-yield savings comparison for when the state-tax exemption tips it.
What Joel decided
Joel split the difference. He moved the $10,000 into a high-yield savings account paying 4.20% for October, set a reminder for the first week of November, and plans to check the new fixed rate before buying. If it comes in at 1.30%, he gets 0.40 point more on every dollar for as long as he holds the bond, for the cost of one month of waiting. If the Treasury surprises and sets it at 0.90% or lower, he will have given up a few dollars of interest, not 30 years of it.
Quick answers
Should I buy I bonds before November 2026? For money you plan to hold five years or more, waiting looks better: October locks in a 0.90% fixed rate for life, and the rule of thumb that has matched every reset since 2022 points to about 1.30% for November. For a one- or two-year hold, the timing makes little difference.
What will the I bond rate be in November 2026? It depends on the September CPI (out October 14) and the fixed rate Treasury sets. If September CPI rises 0.2% and the fixed rate is 1.30%, the composite would be about 4.62%.
When is the last day to buy at the current rate? Your money has to reach the Treasury in October. TreasuryDirect warns that end-of-month purchases can get a November issue date, and October 31, 2026 is a Saturday, so leave several business days.
Methodology
Fixed rates and composite rates come from the TreasuryDirect I bond rate chart effective May 1, 2026. Five-year TIPS real yields are the U.S. Treasury's daily par real yield curve, 2022 through September 25, 2026. For each reset we averaged the five-year real yield from the first day of the prior six-month period through about 10 days before the announcement, multiplied by 0.65 and rounded to the nearest tenth. The Treasury does not publish its exact window or method, so the November 2026 figure is an estimate. The 10-year TIPS figure comes from Federal Reserve data (series DFII10) stored by SwitchWize. CPI-U figures are the not-seasonally-adjusted index from the Bureau of Labor Statistics. The dollar table compounds every six months and assumes 3% yearly inflation after the first period; real returns will differ. The top savings rate is from SwitchWize rate tracking as of September 27, 2026. Joel is a composite character; his situation is illustrative, and the math is real.
Sources
- TreasuryDirect: I bonds interest rates and I bond rate chart
- TreasuryDirect: Series I savings bonds (holding period, penalty, compounding)
- TreasuryDirect FAQ (issue dates)
- U.S. Treasury daily real yield curve rates
- Bureau of Labor Statistics: Consumer Price Index
- Tipswatch: "The I Bond's fixed rate is going higher. But how much?" (Aug. 9, 2026)
Frequently Asked Questions
Should I buy I bonds before November 2026?
What will the I bond rate be in November 2026?
How does the Treasury set the I bond fixed rate?
When is the last day to buy I bonds at the current rate?
Is the difference between a 0.90% and 1.30% fixed rate worth waiting for?
The 5-minute money briefing
One email per week. New rates, fed moves, and what to actually do about them.
No spam. Unsubscribe anytime.
Act on this: today's top savings


Ranked by SwitchWize's composite score. We may earn a referral fee, and it never changes the ranking order.
Editorial review
What changed since the last update
Was this guide helpful?
Found an inaccurate, outdated, or missing claim? Report a correction. We verify reports against the relevant source before changing a guide or ranking.
