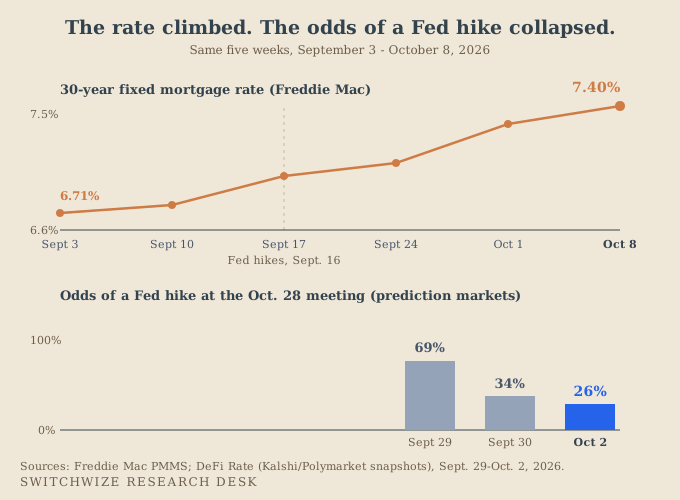
- Freddie Mac's weekly survey put the 30-year fixed mortgage rate at 7.40% on October 8, 2026, the highest reading since mid-November 2023, even as prediction markets cut the odds of a Fed rate hike at the October 28 meeting to roughly one in four.
- This isn't new. The last two times the Fed stopped hiking or actually cut, in 2023 and 2024, mortgage rates kept climbing for weeks or months afterward, because they track the bond market's inflation bet, not the Fed's own meeting calendar.
- On a $320,000 loan, today's 7.40% average costs about $235 more a month than the same loan cost a year ago, and about $191 more a month than SwitchWize's own best-tracked lender is currently offering.
Nadia got pre-approved for her mortgage three weeks ago and still hasn't locked a rate. Her agent keeps asking why. Her answer is the one a lot of buyers are quietly telling themselves right now. The Fed is probably done raising rates, maybe it even cuts next year, so a few more weeks of waiting should get her a better number. While she's been waiting, her number has gotten worse.
On October 8, 2026, Freddie Mac's weekly survey of mortgage lenders put the average 30-year fixed mortgage rate at 7.40%. That's the highest reading since the week of November 16, 2023. The same week, betting markets, sites where people put real money on whether something will happen, priced the odds of an actual Fed rate hike at the October 28 meeting at roughly one in four. Nine days earlier, those same odds were close to seven in ten. The market is leaning harder toward "the Fed is done" than it has in weeks. Mortgage rates went up anyway.
What moved this week
Freddie Mac's survey has now risen five weeks in a row: 6.71% on September 3, 6.76% on September 10, 6.95% the week of the Fed's September 16 hike, 7.03% on September 24, 7.28% on October 1, and 7.40% on October 8. The 10-year Treasury yield, the number mortgage rates actually track, moved the same way: 5.11% on September 23, 5.33% on October 1, and a fresh 24-year high of 5.35% on October 8, a level the 10-year hadn't touched since 2002. It eased slightly to around 5.25% the next day, which matters and gets its own section below.
None of that is the Fed's overnight rate moving. The Fed's target range has sat at 3.75% to 4.00% since the day after its September 16 meeting, completely flat for the entire five weeks above. What moved was the price investors demand to hold long-term government debt, and the mortgage rate that gets built on top of it.
The last two times the Fed stopped and rates rose anyway
This exact disconnect, the Fed pausing or cutting while mortgage rates do the opposite, has happened twice in the last three years, both times recently enough to check directly against Freddie Mac's own weekly numbers.
The Fed's last hike of the 2022 to 2023 cycle landed on July 26, 2023, raising its target range to 5.25% to 5.50% and then holding there. The 30-year mortgage rate did not pause with it. It kept climbing for three more months, reaching 7.57% in mid-October and peaking at 7.79% the week of October 26, 2023, exactly three months after the Fed's last move.
The second instance ran the other direction. The Fed cut its target rate by half a point on September 18, 2024, its first cut of that cycle. Freddie Mac's rate fell to 6.09% the very next day, largely because the bond market had already priced the cut in beforehand. Then it rose for four straight weeks afterward, back up to 6.54% by mid-October 2024, as a stronger-than-expected jobs report and shifting inflation expectations pushed Treasury yields higher again. A Fed cut, and mortgage rates went up for a month.
Both episodes have the same shape as what's happening now: the Fed's own move, hike or cut or pause, told you almost nothing about where the mortgage rate went next.
The bond market sets this rate, not the Fed's meeting
A 30-year mortgage rate is priced off the 10-year Treasury yield, the interest rate the U.S. government pays to borrow money for ten years, plus a markup lenders add for their own costs and risk. It is not priced off the Fed's overnight rate directly. The Fed controls what banks charge each other to borrow money overnight. The bond market sets the 10-year yield based on what investors think inflation will average over the next decade. Investors also want extra interest for locking up their money for ten years instead of one. Economists call that extra interest the term premium, and it grows when investors expect inflation to run hotter for longer.
The ISM's Services Prices Paid index, released October 5, 2026, is a clean read on why that bet got more expensive this particular week. On this survey, any reading over 50 means prices are rising. It jumped to 74.0 in September from 72.6 in August, its highest level since July 2022, as fuel costs, tariffs, and supply-chain pressure pushed service-sector costs up faster than forecasters expected. That is a direct signal that inflation is not cooling the way the Fed's own rate pause would suggest it should. Bond investors read that signal and priced in more inflation risk over the next decade. That pushed the 10-year yield to its highest level since 2002 the same week, and pulled the mortgage rate up with it. The Fed didn't do this. The bond market did, reacting to a different number entirely.
What could still change
Two things in this piece are not settled facts, and both deserve to be stated plainly rather than folded into the headline number.
The 10-year yield's high on October 8 eased the very next day, down to around 5.25%, a drop of about 0.1 percentage points. That dip is a sign the move could be a short-lived spike, not a sign rates are about to turn around for good. Freddie Mac's next weekly reading, due October 15, could show the mortgage rate flattening or even easing slightly if that lower level holds. The 10-year's own October 1 high did the same thing: it eased briefly before climbing again.
The second complication is closer to home. SwitchWize's own live mortgage tracking, pulled the same day as this piece, shows a national average of 6.95%. That's noticeably below Freddie Mac's 7.40% survey figure. The lowest tracked lender, First Shore Federal Savings and Loan Association, is at 6.51%. The gap isn't an error on either side. Freddie Mac surveys a sample of lenders under one specific set of assumptions about fees and points. SwitchWize tracks a different, broader set of lenders' own published rates every day. Neither number is the exact rate any one buyer will actually be quoted. That gap between them, nearly a full percentage point, matters more than either single number does.
What the gap actually costs
On a $320,000 loan, the rate differences above are not abstract. At 6.30%, roughly where Freddie Mac's survey sat a year ago on October 9, 2025, the monthly principal-and-interest payment is $1,980.71. At today's 7.40% national average, it's $2,215.62, a difference of $234.90 a month and about $84,565 in extra interest paid over the full 30-year term.
The second gap is the one a buyer can actually close today. Today's 7.40% national average against SwitchWize's best-tracked lender, 6.51%, is $190.89 a month, $2,290.71 a year, and about $68,721 over the life of the loan. That gap exists on the same day, between real lenders, and it has nothing to do with whatever the Fed decides on October 28.
What to actually do now
Nadia's version of waiting assumed the Fed's calendar was the thing moving her rate. It isn't. The last two times this exact setup played out, in 2023 and 2024, waiting for the Fed cost buyers months, not weeks. So she stopped waiting. She pulled up SwitchWize's lender list instead of her usual market-news feed. She called the credit union sitting closest to the best tracked rate. She locked that afternoon, 0.70 percentage points below the national average Freddie Mac had just reported.
Sources
- Freddie Mac, Primary Mortgage Market Survey weekly releases, September 3 through October 8, 2026.
- Trading Economics, U.S. 10-year government bond yield, October 8-9, 2026 readings.
- Institute for Supply Management, September 2026 Services PMI report (Prices Paid Index 74.0, released October 5, 2026), as reported by TheStreet Pro, "Services Keep Expanding but Prices Climb to Highest Since 2022."
- DeFi Rate, Fed decision odds snapshots, September 29 through October 2, 2026, aggregating Kalshi and Polymarket pricing.
- Freddie Mac, archived PMMS releases, October and November 2023 (7.57% on October 12, 7.79% on October 26, 7.29% on November 22) and September 2024 (6.09% on September 19, rising to 6.54% by mid-October), via Freddie Mac's news release archive.
- Federal Reserve, FOMC statement, July 26, 2023, and FOMC statement, September 18, 2024.
- SwitchWize live mortgage rate tracking, switchwize.com/mortgage, checked October 10, 2026.
Nadia is a composite character; the rate data, historical episodes, and sourced figures cited are real. Rates referenced in this piece were verified on October 10, 2026 and can change after publication. This article is educational information, not individualized financial advice.
Quick answers
Why are mortgage rates going up if the Fed isn't raising rates? Mortgage rates track the 10-year Treasury yield, not the Fed's overnight rate. The 10-year hit 5.35% on October 8, 2026, its highest since 2002. The reason is persistent inflation: the ISM Services Prices Paid index jumped to 74.0 in September, and bond investors priced that in. That happened as prediction markets were simultaneously cutting the odds of a Fed hike, because the Fed's near-term path and the bond market's long-term inflation bet are different things.
Has this happened before, where mortgage rates rose even though the Fed paused or cut? Twice recently. After the Fed's last 2023 hike on July 26, the 30-year rate kept climbing for three more months, to 7.79% by late October. After the Fed cut rates half a point on September 18, 2024, the rate rose for four straight weeks afterward, from 6.09% to 6.54%.
What is the average 30-year mortgage rate right now? Freddie Mac's weekly survey put it at 7.40% as of October 8, 2026. SwitchWize's own daily tracking shows a lower on-page average, 6.95% as of October 10, and a best tracked rate of 6.51% at First Shore Federal Savings and Loan Association. The two measures sample different lenders in different ways, which is why they differ.
Should I wait for the Fed to cut rates before locking my mortgage? The Fed's own rate path hasn't reliably predicted mortgage rates in the last two cycles; both moved the opposite direction from what the Fed's meeting would have implied. The gap between the national average and the best tracked lender, about $191 a month on a $320,000 loan, is a number you can act on today. The Fed's next move isn't.
What to Do Now
Frequently Asked Questions
Why are mortgage rates going up if the Fed isn't raising rates?
Has this happened before, where mortgage rates rose even though the Fed paused or cut?
What is the average 30-year mortgage rate right now?
Should I wait for the Fed to cut rates before locking my mortgage?
The 5-minute money briefing
One email per week. New rates, fed moves, and what to actually do about them.
No spam. Unsubscribe anytime.
Act on this: today's top mortgage



Ranked by SwitchWize's composite score. SwitchWize currently has no compensated product links.
Editorial review
What changed since the last update
Was this guide helpful?
Found an inaccurate, outdated, or missing claim? Report a correction. We verify reports against the relevant source before changing a guide or ranking.
