- About 21% of investors believe they pay no fees at all, because fees are deducted automatically rather than billed.
- A 1% annual fee compounds against you and can cost roughly a quarter to a third of a lifetime portfolio.
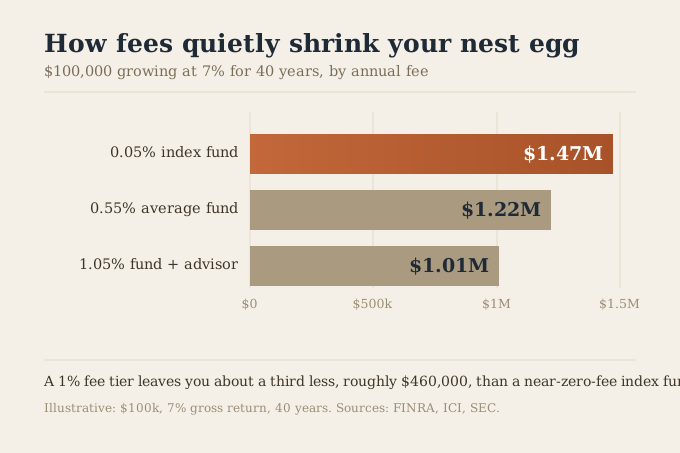
- On $100,000 over 40 years, a near-zero-fee index fund grows to about $1.47M versus about $1.01M at a 1% fee, a gap near $460,000.
There is one cost that most investors pay for decades without ever seeing a bill for it, and it may be the most expensive of their financial lives. Investment fees are not charged the way a subscription or a service is; they are skimmed quietly from your returns before the money ever reaches you, so no line item appears, no notice arrives, and a large share of people conclude they pay nothing at all. That invisibility is exactly what lets a seemingly tiny annual percentage compound into a fortune, just not yours. This report lays out what fees really cost. This page is reviewed by the SwitchWize Editorial Team; the figures are sourced below with dates. Understanding how much do investment fees cost over your lifetime is the first step toward protecting your wealth from invisible erosion.
The numbers
Four figures define the landscape:
- The blind spot. About 21% of investors believe they pay no fees to invest, and 38% of mutual fund investors think they pay no fund fees, per FINRA.
- The going rate. The average equity mutual fund expense ratio was about 0.40% in 2025, per the Investment Company Institute, while active and advisor-sold options run higher, and a typical advisor adds about 1%.
- The lifetime bite. A 1% annual fee can cost roughly a quarter to a third of a portfolio's final value over a long horizon.
- The dollar gap. On $100,000 over 40 years at 7%, that is about $1.47 million at 0.05% versus $1.01 million at 1.05%, a gap near $460,000.
The through-line is that a small percentage is not a small cost. Because fees compound every year alongside returns, the gap they open widens for your entire investing life.
- Value
- ~21%
- Source
- FINRA
- Value
- ~0.40%
- Source
- ICI
- Value
- ~1% of assets
- Source
- Industry
- Value
- ~25% to 33% of portfolio
- Source
- SEC / analysis
- Value
- ~$1.47M vs ~$1.01M
- Source
- SwitchWize calc
The invisible tax
The reason fee drag persists is psychological as much as mathematical. A fee you are billed for, you notice, question, and shop. A fee deducted automatically from a fund's assets, before any return reaches you, produces no statement line and no moment of decision. So it goes unexamined, which is how 21% of investors conclude they pay nothing while paying steadily for decades.
That invisibility makes fees uniquely worth attention. Unlike market returns, which you cannot control, your fee is a number you can look up and change, and lowering it is one of the few close-to-guaranteed improvements available to an investor. The first step is simply to find out what you actually pay.
Why 1% costs a third
The damage seems out of proportion to the number, and the reason is compounding. A fee does not just take 1% of this year's balance; it takes 1% every year, and each dollar it removes is a dollar that never compounds for the rest of your investing life. Over a few years the effect is small. Over 40 years, the fee's cumulative drag mirrors the very compounding that grows the portfolio, in reverse, so a 1% fee erases far more than 1% of the ending value, roughly a quarter to a third of it. See the difference your own fee makes:
Compare two entered annual-fee scenarios while holding gross return and contributions constant.
Historical market avg: ~10% nominal
Enter the all-in annual fee for the current scenario.
Enter the all-in annual fee for the comparison scenario.
Signed Comparison Value Difference
$168,566
Use this result as one input in your broader Money Map, not as a one-off number.
What to do
Compare brokerage accounts
Pre-tax estimates. For illustration only — not financial advice.
What it costs one household
Make it concrete. Invest $100,000 and let it grow at a 7% gross return for 40 years. In a low-cost index fund charging 0.05%, it becomes about $1.47 million. In a typical fund-plus-advisor arrangement charging 1.05%, it becomes about $1.01 million. The difference, roughly $460,000, did not vanish into bad markets; it went to the fund company and the advisor, extracted a fraction of a percent at a time.
That is on a single $100,000. Applied to ongoing contributions across a career, the lifetime cost of a high fee runs well into the hundreds of thousands for an ordinary investor. The mirror image is the opportunity: cutting the fee keeps that money compounding for you.
Compare two entered annual-fee scenarios while holding gross return and contributions constant.
Leave at $0 to model existing portfolio only
Enter the gross return assumption you want to test; returns are not guaranteed.
Enter the advisory fee shown in the agreement or proposal.
Enter the all-in annual fee for the alternative scenario.
Alternative Scenario Value
$1,916,840
Use this result as one input in your broader Money Map, not as a one-off number.
What to do
Compare savings accounts
Pre-tax estimates. For illustration only — not financial advice.
The honest counterargument
Not every fee is waste. A good financial advisor can earn a fee through planning, tax strategy, and, most valuably, coaching a client to stay invested through a crash rather than selling at the bottom, a single avoided mistake that can outweigh years of fees. Some specialized funds justify a higher expense ratio, and the cheapest option is not automatically the right one for a complex situation.
The point is not that all fees are bad; it is that most fee drag buys nothing. A 1% advisor fee on a portfolio of ordinary index funds, or a 1% expense ratio on an active fund that trails the market, is a large lifetime cost for little in return. Index funds capture the market's return for a few hundredths of a percent, so the honest question for any fee is simple: is it buying something worth roughly a third of your eventual portfolio? Sometimes yes. Usually not.
Methodology
The illustrative figures apply a 7% gross annual return to a $100,000 investment over 40 years, compounded annually, net of the stated fee; 7% is a long-run assumption, not a guarantee, and real returns vary. The "quarter to a third" range for a 1% fee reflects SEC and industry analysis across common horizons and returns. Fee-awareness figures are FINRA survey data; average expense ratios are the Investment Company Institute's 2025 figures. A machine-readable version of the scenario figures is published at /data/investor-fee-drag.json. Nothing here is individualized investment advice.
How we source this. Fee-awareness data is FINRA's, expense-ratio averages are the ICI's, the lifetime-cost range is SEC and industry analysis, and the dollar figures are standard compounding math, all cited with dates. See our methodology and editorial team. We take no payment for organic rankings.
Sources
- FINRA, investing fees and commissions: share of investors unaware they pay fees.
- Investment Company Institute, 2025 fund fee data: average expense ratios.
- US Securities and Exchange Commission analysis of how a 1% fee compounds over time; SwitchWize compounding calculation for the $100,000 illustration.
Figures are current as of mid-2026 and are illustrative; real returns and fees vary. This page is informational, not investment advice. Free to cite with attribution to SwitchWize.
Frequently Asked Questions
How much do investment fees actually cost?
Why do so many investors think they pay no fees?
What is a reasonable investment fee?
Is paying a 1% advisor fee worth it?
How do I reduce investment fees?
Answer a few questions about your situation and goals. Money Map points you to the highest-value next step across savings, mortgage, cards, and debt.
Editorial review
What changed since the last update
Was this guide helpful?
Found an inaccurate, outdated, or missing claim? Report a correction. We verify reports against the relevant source before changing a guide or ranking.
