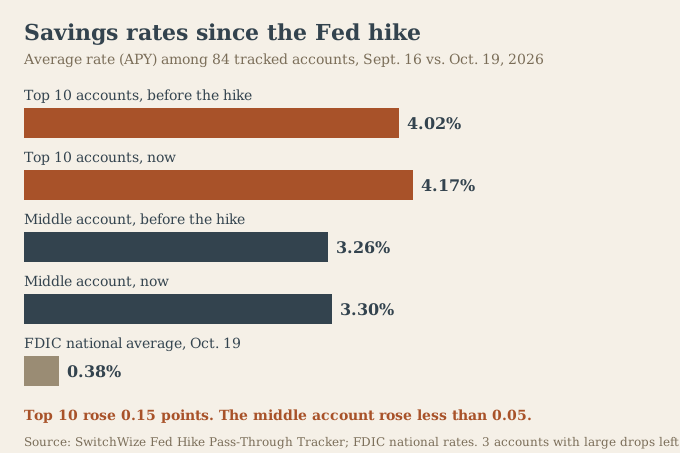
- On October 19, 2026, the 10 highest savings rates SwitchWize tracks averaged 4.17%. On September 16, the day the Fed raised rates, the 10 highest averaged 4.02%. That is a rise of 0.15 points.
- The middle account among 84 tracked moved from 3.26% to 3.30%, a rise of less than 0.05 points. The Fed's hike was 0.25 points.
- On $10,000, the gap between the top 10 average and the middle account grew from $76 a year to $87.
Take a saver we'll call Daniel. He is an illustration, not a real person. He keeps $10,000 in a savings account that pays 3.30%, which happens to be the middle rate among the 84 accounts SwitchWize tracks. After the Federal Reserve raised its target range a quarter point on September 16, he figured every savings rate had gone up and his had too. He did not check. His account earns about $330 a year.
The top 10 accounts now pay an average of 4.17%. On the same $10,000, that is about $417. Daniel is $87 a year behind, and the gap is bigger than it was before the hike.
What changed at the top
SwitchWize's Fed Hike Pass-Through Tracker records one savings account per bank. We compared each account's rate on September 16 with its rate on October 19. Three accounts fell by more than two points, which is probably a product or reading change rather than a real cut, so we left them out. That leaves 84.
Here is the top of the list now:
- Openbank 4.35%, up from 3.80%.
- Peak Bank 4.27%, up from 4.01%.
- PiBank 4.25%, up from 4.10%.
- EverBank and Western State Bank 4.20% each, up from 3.90% and 4.00%.
- Newtek Bank 4.20%, unchanged. It was already the highest rate on September 16.
The highest single rate went from 4.20% to 4.35%, up 0.15 points. The average of the 10 highest went from 4.02% to 4.17%, also up 0.15. Fourteen accounts now pay 4.00% or more. On September 16, eight did.
Nine of today's top 10 raised their rate after the hike. Of the 10 highest on September 16, six raised theirs. Seven banks appear on both lists. The best rates did not just drift up. Several banks that started a little lower moved past some that stood still.
What the middle did
The middle account moved from 3.26% to 3.30%, less than 0.05 points. The average across all 84 rose from 2.70% to 2.77%. That average is pulled down by 15 accounts that pay under 1%.
Our day-33 report showed that 54 of 87 accounts had not changed at all, and the 30 that moved added 0.20 points on average. Both findings fit together. The accounts that moved were mostly near the top already, so they lifted the top of the market. The ones that stood still were spread across the middle and bottom.
What the gap costs
On $10,000, a year at each rate pays about this much:
- Top 10 average, 4.17%: $417.
- Middle account, 3.30%: $330.
- FDIC national average, 0.38%: $38.
Before the hike, the top 10 average of 4.02% paid about $402 and the middle account at 3.26% paid about $326. The gap was $76. It is $87 now, about $11 wider. The gap against the national average is far larger. The FDIC posted a national average savings rate of 0.38% on October 19, 2026.
Why the top moves first
The Fed does not set savings rates. Each bank decides how much of a move to hand to savers. Banks that compete hardest for new deposits, mostly online banks, may have more reason to raise their rate quickly. A bank with plenty of deposits may have less. The Fed's September 16 statement said the committee voted 12 to 0 for the quarter-point increase. It did not say whether more increases would follow. SwitchWize's guide to deposit beta explains in plain terms why some banks pass on more than others.
What this data cannot say
It covers 84 accounts, one per bank, not every bank. A bank we do not track could pay more than 4.35%. Some banks pay their top rate only above a minimum balance or with conditions, and we do not rank those differences here. Rate readings can also lag the real change by a day or more, and some readings are older than others. The top 10 contains different banks than it did on September 16, so this compares the best available rates then and now, not the same 10 accounts.
What to do with it
Look up what your account pays today and compare it with the highest rates, not with what your bank paid last month. Then do the sum on your own balance. If you keep $10,000 at 3.30%, the gap to the top 10 average is about $87 a year. At $50,000 it is about $435. Check the account's conditions before you move money. The Fed meets again on October 27 and 28, and rates can change again afterward.
Daniel looked up the top 10 on a Tuesday. He read the conditions on the Peak Bank account, which pays 4.27%, and wrote the date he opened it on his calendar next to the date of the next Fed meeting.
Frequently Asked Questions
What are the best savings rates after the Fed hike?
Did the best savings rates go up after the Fed raised rates?
How much more does a top savings account pay than a typical one?
Does this cover every savings account in the country?
The 5-minute money briefing
One email per week. New rates, fed moves, and what to actually do about them.
No spam. Unsubscribe anytime.
Act on this: today's top savings


Ranked by SwitchWize's composite score. SwitchWize currently has no compensated product links.
Editorial review
What changed since the last update
Was this guide helpful?
Found an inaccurate, outdated, or missing claim? Report a correction. We verify reports against the relevant source before changing a guide or ranking.
